Good day, good people of steemit. I am happy to be doing this again. I went through the lecture with so much Interest and then decided to carry out the task to the best if my ability.
QUESTIONS
(1a) Explain the Japanese candlestick chart? (Original screenshot required).
(b) In your own words, Explain why the Japanese candlestick chart is the most used in the financial market.
(c) (c) Describe a bullish and a bearish candle. Also, explain it's anatomy. (Original screenshot required)

(1a) Explain the Japanese candlestick chart? (Original screenshot required).

Candlesticks ussually creates a visual representation of the movements of price which helps to summarize important and useful information a trader needs to know. This information is shown in a single bar. This information are in a very simple format which makes it easy for traders to identify patterns that can help them make decisions on the markets.
A candlestick is a single bar which shows market price movement at a glance. Each candlesticks tells about the open price, low price, high price, and close price of a mark in a specific period of time. These patterns helos traders to predict price movement and make future predictions using technical analysis. It is usually being reffered to as Japanese candlesticks because they were first used in Japan as far as the 18th century.
The japanese candlestick chart is a chart in which both forex and cryptocurrency traders use in finding solutions to their purposes in the market. This may range from knowing about how the prices of different assets are moving from one trend to another in the market. This japanese candlestick chart was developed far back by a japanese rice trader whose name is Munchisa Homma.
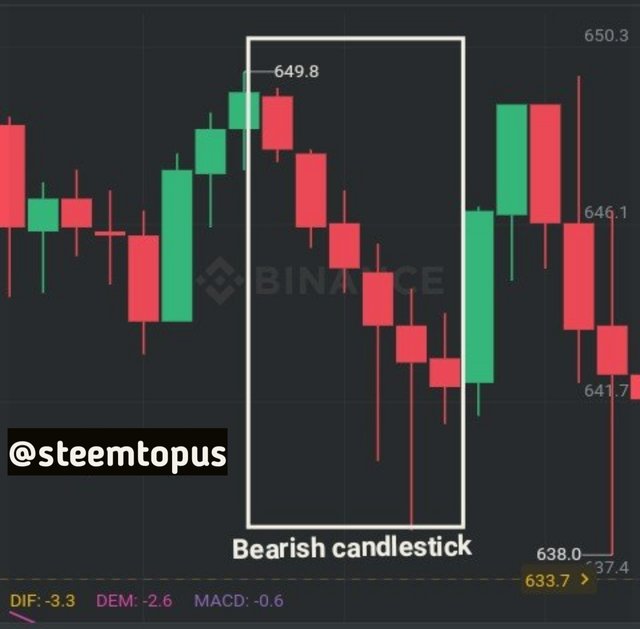
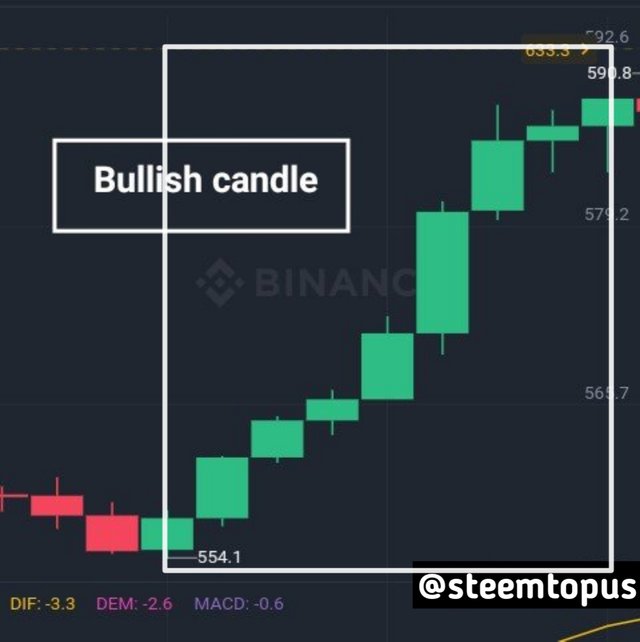
The changes in the prices of assets wheher increasing or otherwise will help the trader to make decision about when to enter or exit the market. It would help beginers to read, understand and analyze the market easily as it’s bieng represented by the green and red colors. Generally, the green color is ussually of positive significance while red ussually tells you to stop as it is dangerous. Where there is a positive uptrend i. e. when the market is increasing, the market is known to be in the bullish phase and the green colour ussually represent this. And when the markets tends to decrease as in the opposite casem the market is said to be bearish. This is represented by the red colour.
This is specified in the screenshot below

Screenshot from binance and editted on pixellab
The green and the red color are the used in the candlestick chart to analyze and read through the direction in which the market is faced which may be the bullish or the bearish trend. People who have quite some experience and professionalism in cryptocurrency can equally take advantage and make good use of this. Predicting the market, the price movement better. If he does that correctly, he would be making a lot of profits. So directly saying, the japanese candlestick can be used to make a lot of profit and equally minimize loss regarding trading.
The two candles (bullish and bearish) in the japanese candlestick chart have their differences even though to look so much similar and play an important roles to traders.
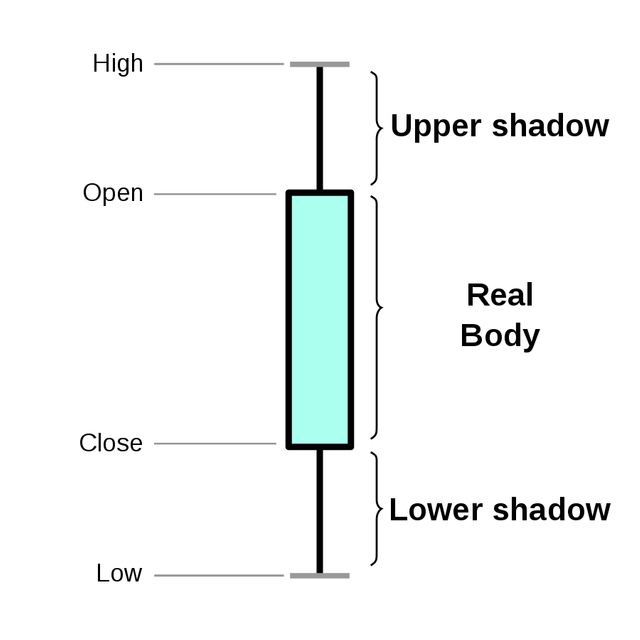
When analyzing the charts, the bullish and bearish have four important part in which a trader should not turn a blind eye to as they are sure essential. These are the high, the open, the low, and the close.

(b) In your own words, Explain why the Japanese candlestick chart is the most used in the financial market.

The japanese candlestick chart is mostly used in the financial market because of the following reasons.
It maximizes profit and mininizes loss
As mentioned early, the japanese candlestick chart helps traders to know when to enter the market. This would help them from making any mistake that could incur them a lot of loss. It also creates the opportunity of making a lot of gains when they enter and the right time and avoid loss when they know when to exit .
It is simplified
The charts are designed in a way that it becomes simple to everyone especially the beginers. It is one of the charts that is ussualy used to explain cryptocurrency price movement to newbies because it is simple and stress free.
It is easily understood
Just as how simple as it is, the logic behind the chart is also very understandable. This will make the beginer to easily learn on how to study the chart on their own and at the convenient time they pick.
It can be easily predictied
It can be easily predicted for people that have the experience and make use of the charts for a long time. Using the previous movement of the charts, they are able to predict the future price movement and when done accurately can bring them a lot of profit.
Movements of assets
With the charts, the trader can easily learn about the movement of the assets price. Uptrend showing price increase and vice-versa.
Decision making
When the traders are able to read through, analyze, understand the charts and know the price movements, it becomes handy as it helps him in making decision about entering or exiting the market.

(c) Describe a bullish and a bearish candle. Also, explain it's anatomy. (Original screenshot required)

The bearish and bullish candle are the two candle that are being found in the japanese candlestick chart. These two have close features and importance.
They have four very useful part which are
- The high
- The low
- The open
- The close
The anatomy of bullish candle

This is an important and useful candlestick as it plays a great role on how the trade makes profit and when he can enter the market to sell of his assets. This is green in color and has four important parts mentioned above:
The high
This particularly help the trader know the highest price of the assets in the bullish candle at a specific period of time.
The low
This is the opposite of “the high”. It enlightens the trader about the lowest price of assets in the bullish candle in a particular period of time.
The open
Like every new day starts, the open helps the traders to know the price in which the candle start in a specific period of time.
The close
Like the day ends likewise, this allows trader to know the price in whiich the candle stop in a particular period of time.
Mostly, this is the the bullish candle helps traders to know when they can capitalize on the market and make a lot of profits.
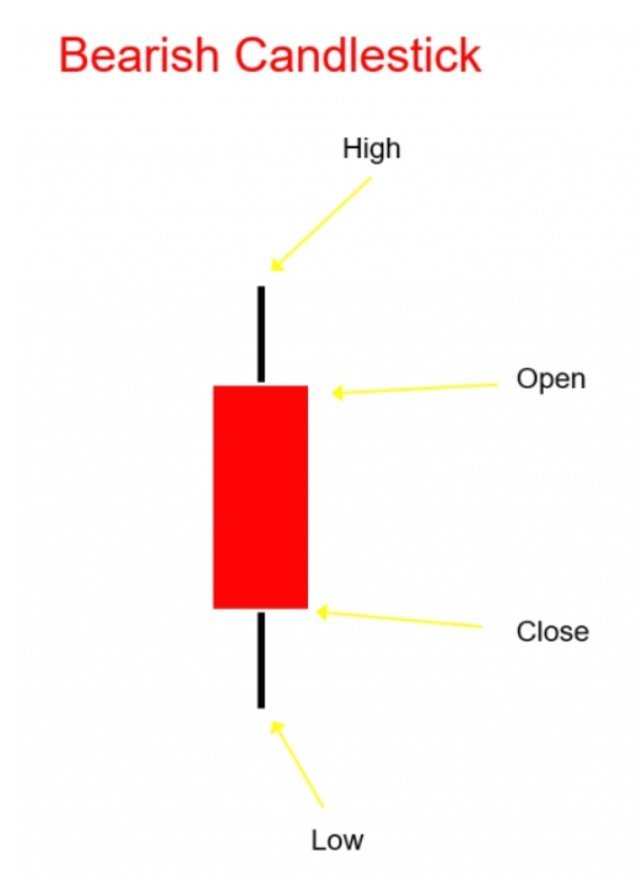
The anatomy of a bearish candle.

The bearish candle helps to know about the charts. When the market is decreasing, it helps traders exit as soon as posibble to minimize the loss that may come with it. This candle is red in colour and also has four important part which cannot be neglected.
The high
This particularly help the trader know the highest price of the assets in the bearish candle at a specific period of time.
The low
This is the opposite of “the high”. It enlightens the trader about the lowest price of assets in the bearish candle in a particular period of time.
The open
Like every new day starts, the open helps the traders to know the price in which the candle start in a specific period of time.
The close
Like the day ends likewise, this allows trader to know the price in whiich the candle stop in a particular period of time.
It is said that the market is best avoided during the bearish trend. The bearish candle notify us about this and helps traders exit the market and minimize loss.
Conclusions
I can say that the topic is quite simple because of the simplicity of the japanese candlestick chart. Traders can makes good use of this tool to maximize profit and prevent loss.
I am very grateful to prof @reminiscence01 for this lecture. Thank you prof @dilchamo for your hardwork.
.png)


#club5050 😀
Downvoting a post can decrease pending rewards and make it less visible. Common reasons:
Submit