Hello everyone, I hope you are all doing great. It has been a great pleasure taking part in this particular lecture by @fendit, below is my submission.
The composite man is a heuristic method or a useful fiction that helps to understand the price changes of individual stocks and the entire market and was written by Richard Demille Wyckoff in 1931 (Pioneer of stock market research techniques in the early 20th century).
This methodology is behind all the market uptrends and downtrends (according to Wyckoff). He recommended investors and traders to treat the stock market like any other transaction. This means that investors should only buy when the price is low and sell when the price is high. Wyckoff further went on and advised investors and traders that;
“If you learn to understand the market behavior of the so-called Composite Man, you can learn to make judgments, then conclusions, that should have a positive effect on your stock market operations.”
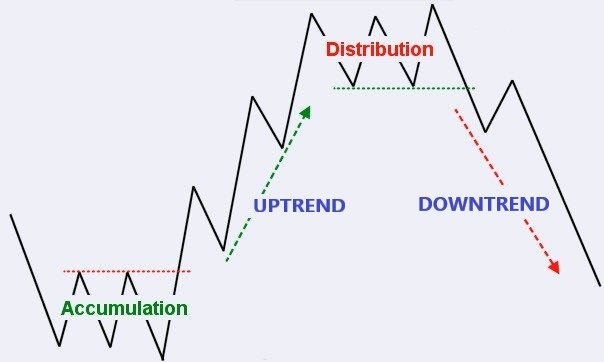
The "man" we are talking about here actually acts, thinks, and make moves like a general, so it is up to us (investors) to read, study and detect his main moves by following all his strategies. The strategy consists of 4 phases, thus; accumulation, uptrend, distribution, and downtrend. Let's look at what each phase means.

The accumulation phase is the interval and horizontal restriction period that occurs after a long-term downtrend. This is the area where big traders/investors try to establish positions and do away with small fishes (investors with fewer funds) without causing a sharp drop in prices.
_When the big investors (composite man) have enough shares and their sales force is exhausted, they start to push the market up. This attracts more and more investors, leading to increased demand.
It should also be noted that there can be multiple accumulation stages during an uptrend. When the larger trend stops for a period of time and integrates before continuing its upward movement, we can call these phases accumulation phases. When the market rises, other investors are encouraged to buy. At some point, even the general public will be excited to realize this: At this point, demand exceeds supply immeasurably.-
This is the phase where the compound man (big traders/investors) starts to distribute his wealth and sell his profitable positions to those who are late to enter the market. Generally speaking, the distribution stage is characterized by lateral movement, absorbing demand until exhaustion.
After the end of the distribution phase, the market begins to fall; in other words, after the big investors are done selling most of their shares, they begin to push the market down. The downward trend starts to emerge. Like an uptrend, a downtrend can also have a redistribution phase, which is mainly a short-term consolidation between sharp price drops. It can also include bull traps, where some buyers/investors get trapped and tend to hoping that a trend reversal doesn’t occur. When the downtrend finally ends, a start of a new accumulation phase begins.
Richard Demille Wyckoff's graph-based approach of the composite man is based on three "laws" with great impacts on many aspects of analysis. This includes determining the current direction and future potential of the market and individual stocks, selecting the best stocks for long-term or short-term trading, and determining market maturity. These laws govern the analysis of every chart and the choice of every traded stock.
1. The law of supply and demand
This particular law states that, when demand exceeds supply, prices rise, and when supply exceeds demand, prices fall. Traders/analysts can check the balance between supply and demand by comparing prices and volume over a period of time. This law may seem simple, but learning how to accurately estimate supply and demand on a graph/chart and understanding their effects requires a lot of practice.
2. The law of cause and effect
The second fundamental law helps traders and investors set price targets by measuring the potential degree of trends outside the trading range. Richard Demille Wyckoff's "cause" can be measured by calculating the horizontal points on a chart, and the "effect" is moved according to the price and distance of the points. The effect of this law can be seen as the cumulative or distributed force within the trading interval, and how this force is reflected in the subsequent upward or downward trends.
3. The law of effort
Wyckoff's third law states that changes in asset prices are the result of efforts represented by transaction/trading volumes. If the asset price is consistent with its volume, then there is a great chance that the trend may continue else, the market trend is likely to stop or change direction.
For example, suppose that the Ethereum market starts to consolidate with very large trading volumes after a long downward trend. The Large trading volume indicates more effort, but steady/sideways movement (low volatility) suggests small outcomes. This implies that there are a lot of Ethereum changing hands, but the price no longer drops significantly. Such a situation indicates that the downtrend may possibly be over, and a reversal is imminent.
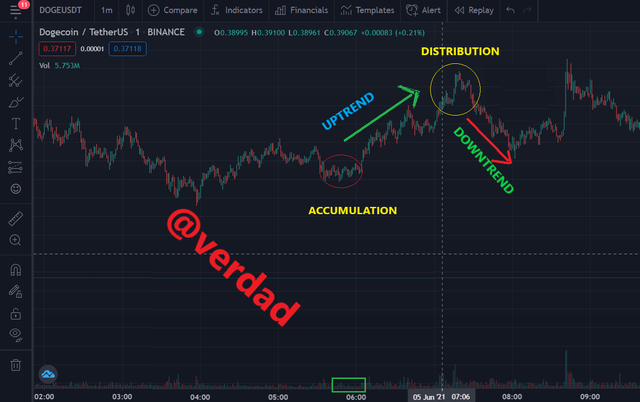
Share a chart of any cryptocurrency of your choice (BTC or ETH won't be taken into account for this work) and analyze it by applying this method. Show clearly the different phases, how the volume changes and give detail of what you're seeing.
.png)
From the screenshot of Dogecoin/Tetherus above, it can be seen that a lot of investors (Whales) tried to build/establish positions by eliminating the smaller fishes (investors with fewer investments) without causing any high price drops at the accumulation phase. Thus; It’s the period where the prices of assets are gradually accumulated to avoid significant changes.
Also, at the Uptrend phase, the composite man (Whales) starts to attract the attention of investors who refused to enter the market at the accumulation stage by pushing the market upward. It should also be noted that a re-accumulation can occur at this stage to integrate the higher trend before continues its movement (uptrend).
At the Distribution phase, the component man (all the big investors) begins to distribute/sell all his assets to investors or traders who entered the market late to gain profits knowing very well that there is going to be a decrease in the market volume (downtrend).
After the Whales are done selling most of their assets, the market volume starts to fall (downtrend phase), which leads to a great loss for investors who entered the market late with the hope of gaining profit. Just like the uptrend phase, a re-accumulation can occur at this phase as well.
The "composite man" methodology enables investors to understand stock price trends(uptrends and downtrends) to a large extent in other to gain profits from assets, just like institutional traders and other large traders who manipulated stock prices in their favor. This method has not been widely accepted by retailers, although its main focus is to educate the public about the "real rules of the game." The discipline associated with this approach allows investors to easily make business decisions. The Wyckoff method can be used to invest in stocks with the intention of capitalizing on the benefits of big clever funds, rather than getting into the wrong side of the market. It takes a lot of practice to be perfect on Wyckoff's analysis, but it's worth it. THANK YOU @fendit for such a great lecture
Thank you for being part of my lecture and completing the task!
My comments:
Nicely done! :)
All explanations were really good and you were able to identify the pattern correctly :)
Overall score:
7/10
Downvoting a post can decrease pending rewards and make it less visible. Common reasons:
Submit