Hey, friends hope you are well and welcome the new update on the Band DeFi token. In this video you will watch how:
The priceline of Band token has broken down 25, 50, and 100 SMAs and it can move down to 200 SMA as well.
Click here to create an account on Binance, the best place to buy or sell BAND token
The price line has found very strong resistance at $16.
The EMAs 10 and 21 are bearish, the directional movement indicator is also bearish and has given sell signals but the stochastic is bullish now the stochastic can also follow the bearish signals of other indicators.
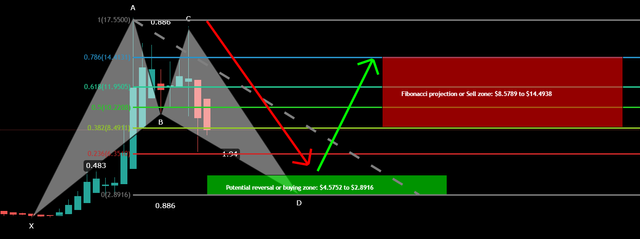
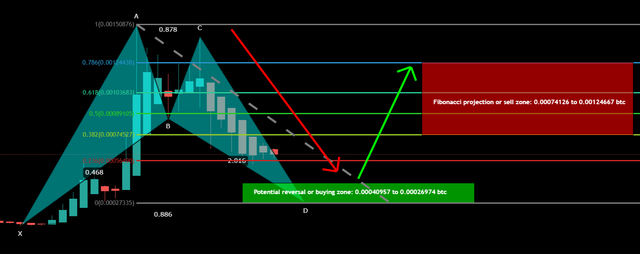
On a 4 day chart, the pricelilne of BAND is completing the final leg of bullish BAT with the US dollar and the Bitcoin pairs as below.
BAND with US Dollar BAT move:

BAND with Bitcoin BAT move:

The targets can be as below:
BAND with US Dollar BAT move targets:
Potential reversal or buying zone: $4.57 to $2.89
Fibonacci projection or Sell zone: $8.57 to $14.49
BAND with Bitcoin BAT move targets:
Potential reversal or buying zone: 0.00040957 to 0.0002697 btc
Fibonacci projection or sell zone: 0.00074126 to 0.001246 btc
Conclusion:
The priceline can move more down to complete the final leg of the bullish pattern for the next rally. However, the PRZ levels should be used as stop loss. Because if the potential reversal zones will be broken down then the price action of the BAND token can move more down to complete Crab pattern.
Shared On DLIKE
