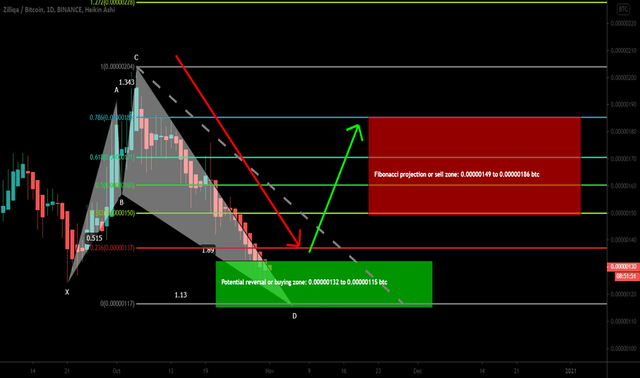
Previously I posted an idea, in which the Zilliqa formed a bullish Shark. Now the idea has been executed and produced more than 64% rally so far.

Click here to create free account on tradingview to watch and play the chart on realtime
Now on weekly chart, the pricline of Zilliqa coin has been rejected by 100 SMA and also having good support of 50 SMA as well.
The priceline of Zilliqa has formed a falling wedge pattern on 7 days chart. And now likely to be rejected by the resistance. Therefore we can expect another retest of support before the breakout.
On daily chart, the price action has been rejected by 200 SMA. The 50 SMA is below the 200 SMA, if the 50 SMA will move up and form golden cross with 200 SMA then a breakout will be confirmed.
For a long time period the price action of Zilliqa is moving below the bearish cloud, now the cloud is weak therefore there is strong possibility for a powerful bullish rally soon.
Click here to create an account on Binance, the best place to buy or sell Zilliqa
Click here to join Tronchain to earn highest ROI and UME token mining

Shared On DLIKE
