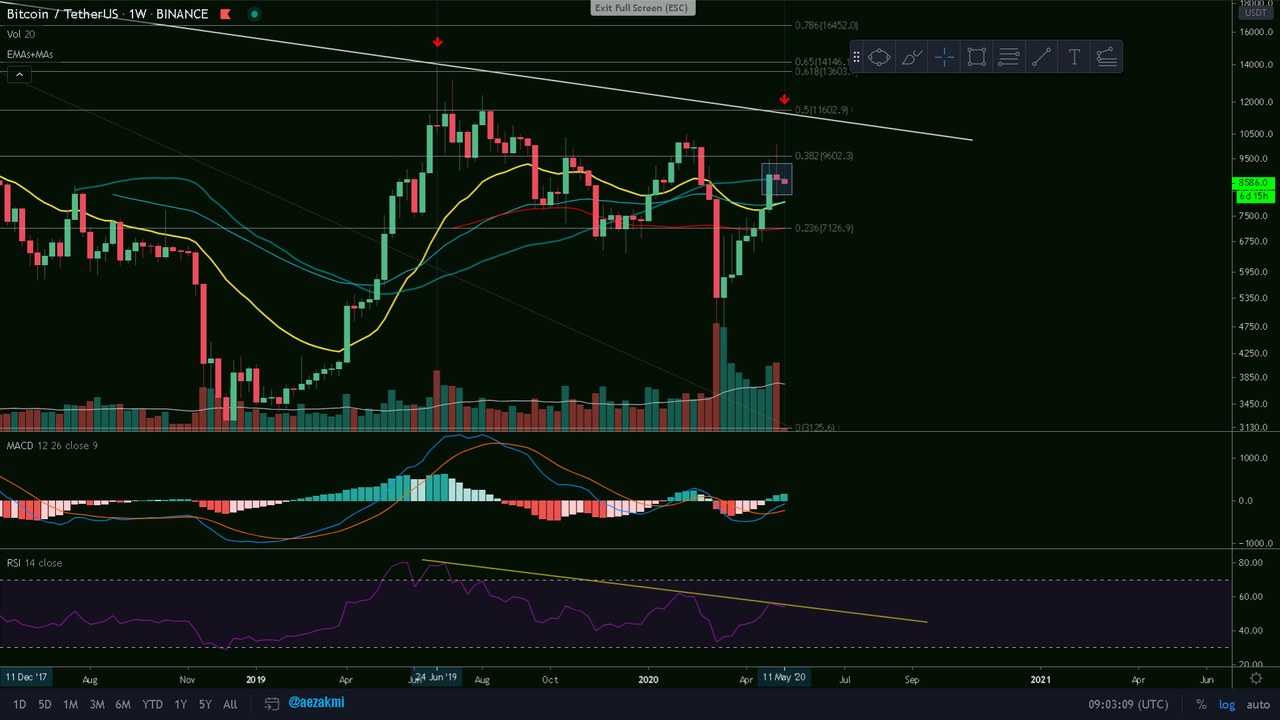
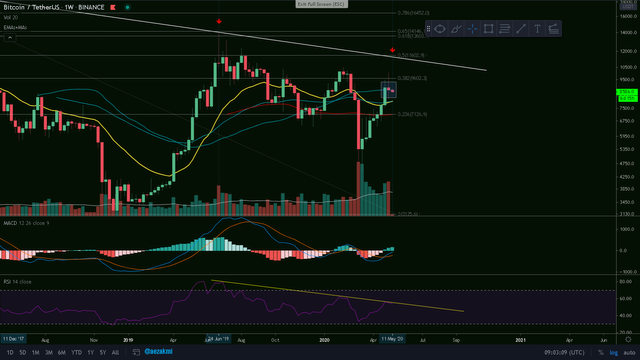
BTC/USD Weekly Chart
With yesterday's sudden drop, we closed the weekly candle right at the 50 MA and started the new one downwards. We have some 25% room left to reach the $11k levels and I think it is still doable. In my previous post I mentioned that the $11500 level is an attractive target and a possible great short entry and I'm holding my opinion; I still believe that we could have a candle wick reaching that specific target. We have the RSI fighting at a descending trend line and could have it reach near the upper reference line in case of the $11500 price action. Closing the weekly (preferably monthly) candle above this level, would probably put us in a new bullish cycle.
Ctrl + Click here to enlarge the image in a new tab (steemitimages)
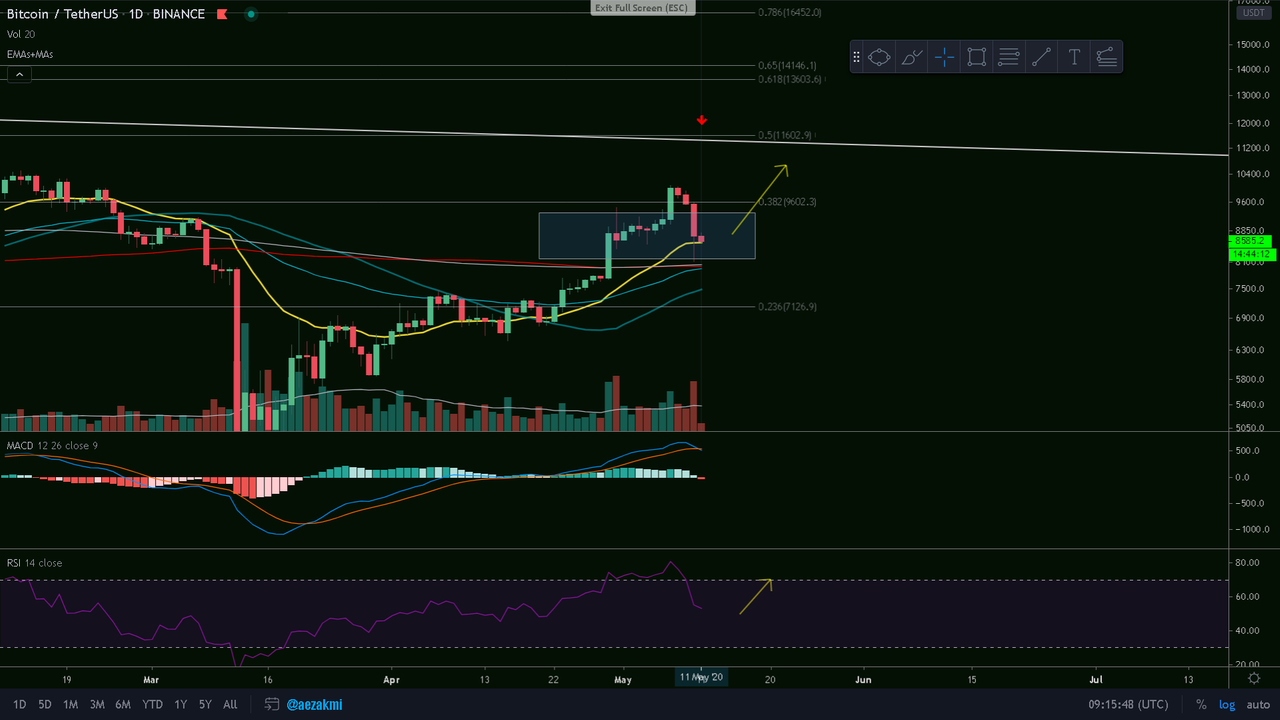
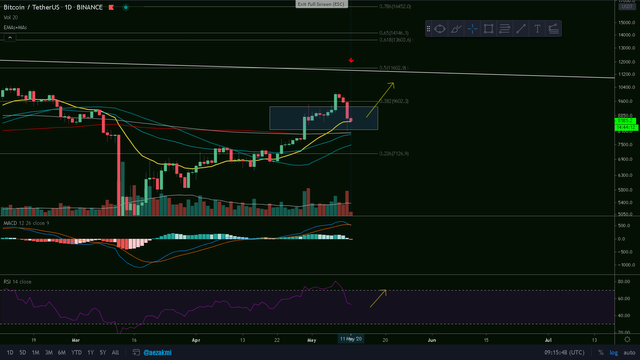
BTC/USD Daily Chart
On the daily we just reached the 21 EMA (yellow), with yesterday's candle wick extending to the 200 MA. Getting a higher high on the price, with a lower low on the RSI and MACD, would be perfect.
Ctrl + Click here to enlarge the image in a new tab (steemitimages)

Join the Crypto Den HERE!

Thanks for reading and safe trading!✌
If you find this post useful, please:
