Cryptocurrency trading plan is a comprehensive plan or ideology that controls the decisions of a cryptocurrency trader.This strategy is dependent on factors like the duration a Trader is willing to hold a coin , the psychological strength of the trader and how much time the trader wishes to invest .
The cryptocurrency market is one which is very volatile and unpredictable and one that can create a lot of panic and impulse, so there is every need to have some sort of plan or strategy that determines when to sell, buy, and what to do Ir reaction to any market trend.
There are two kind of trade of trading plans ; the active and passive trading plan, my focus is going to be on the active trading plans and under the active trading plan we have the Swing, trend, and day trading .
What trading plan do I prefer?
A trend plan like was stated above is very necessary for cryptocurrency trading even though it is not a prerequisite for trading,the importance of a trading plan cannot be overemphasised. The trading plan I find more interesting and convenient is the Trend tracing.
Why do I prefer the TREND TRADING PLAN
This trading plan is in which the trader intends to hold a coin or cryptocurrency asset for a few months, say six months. The trend trading plan does not require much time for reading and following charts like the day and swing trading plans. This trading plan requires a strong fundamental analysis and also some good technical analytical skills.
A trend trader does not bother much about the day to day rise and fall of coin price but he or she may view monthly time interval charts to determine a great exit and entry plan .
What is a cryptocurrency asset pair?
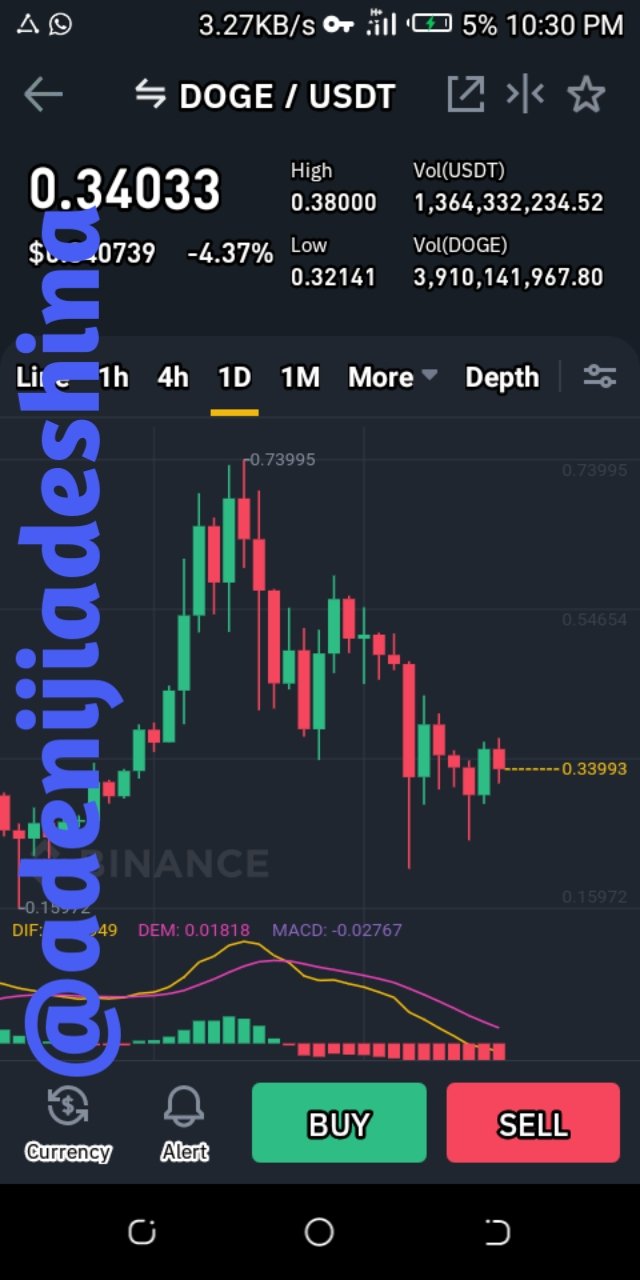
A cryptocurrency Asset pair can be any two two coins which are traded against each other or it can be a coin traded against a stable coin, examples are Doge coin against Binance coin ( DOGE/BNB) and Doge coin against Tether ( DOGE/ USDT)
DOGE/USDT
This is a trading pair that gives the value of dogecoin in USDT, a stable coin, and this helps to give a quite stable value that can be used to compare other ccryptocurrencies. Using a stable coin as a reference is good because it is easier to measure value from a fixed standard and USDT is that standard .

My entry and exit strategy
Entry and exit strategies are basically the psychological triggers that you have observed with time and from technical analysis to be effective in making a profit; an a good level of efficienc. So there are triggers that prompts traders to buy and sell and it varies across traders.
My entry and exit strategy is as follow:
Entry strategy: My entry strategy can be summarized with the word " confirmation " . I look for a very great downtrend and just at its base is where I wait for a small bullish run and then ehen this eventually happens, I do not buy but wait for a little pullback and then I buy immediately l spot another( confirmation ) uptrend .
This strategy is efficient as we targetted the base of a bearish run , because the whole market tends to correct itself and that gives me a good chance of a long bullish trend later, even though it is not certain.
Exit strategy : I exit the marked in phases and not completely , that is, whenever I experience the bullish rum anticipated above, I sell some of my position, say 50 %, when the market breaks my resistance level and I hold the rest incase of an unexpected high.
Multiple time frame Analysis
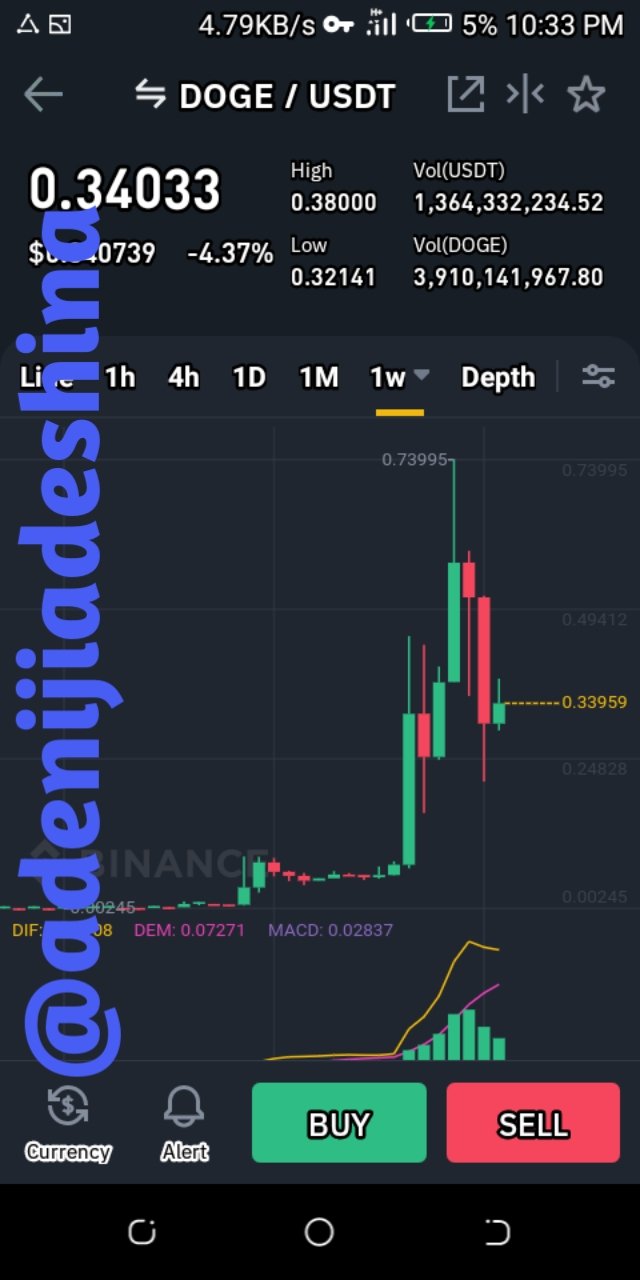
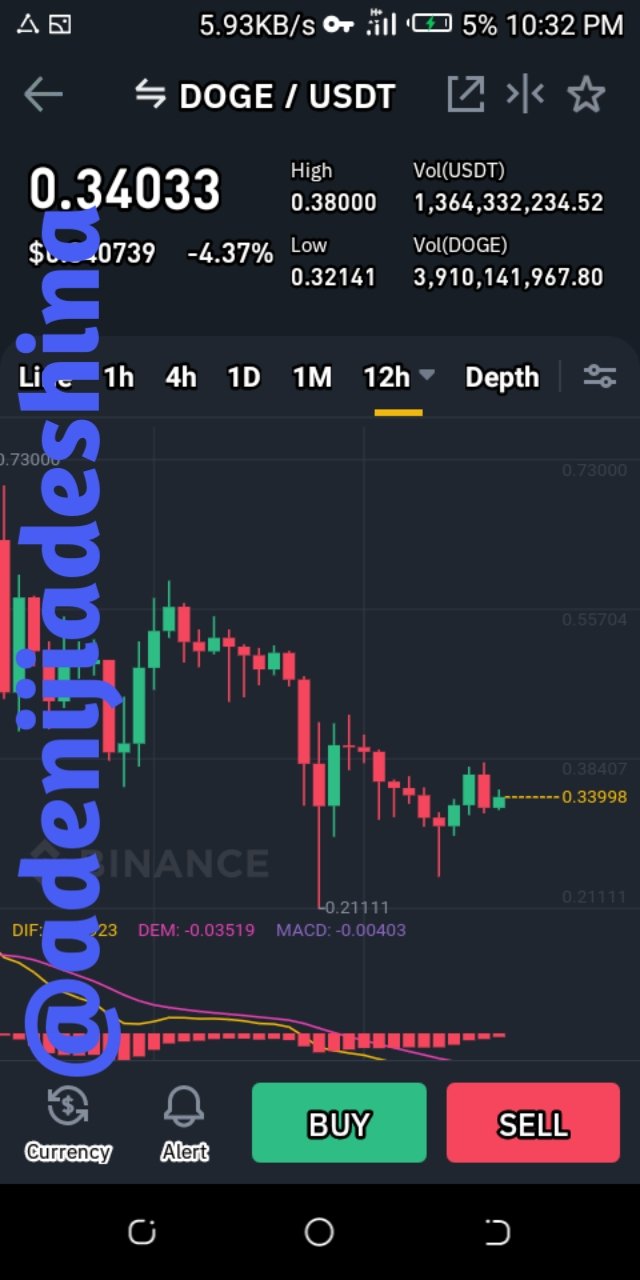
Analysis can be done in various time intervals depending on the kind of trading strategy employed, for instance, a trend trader mostly makes use of the one month Japanese candle chart , but the unique thing about multiple time frame analysis is that you can read from a combination of charts from different time frames to get a good Picture of the market. So insted of only reading a monthly chart, a trend trader can read a combination of two or more charts using two different monitors.


The use of indicators in analysis
Moving average (MA) : This kind of indicator takes the average of the highs and lows of a market divided by the time frame in question. This is a very popular tool in technical analysis because of its simplicity to calculate and its efficiency. It tells the trader what to expect based In the happenings of the past.
Moving average convergence and divergence (MACD) : This indicator makes use of two exponential moving average(EMA) lines , the signal Line and the MACD line , and the prediction is based on the convergence, divergence, and intersection of these lines. It also has a histogram that is displayed above or bellow the Zero line which indicates the momentum of a bullish and bearish run respectively.
Trade Management
Cryptocurrency trading like we know is very unstable and in order to make profits , we have to be willing to take some risks .
(1) Stop loss: Stop loss is a limit that is implemented automatically on an eexchange when the price of a coin begins to fall. When trading, one can set a stop loss limit bellow which the system automatically sells the positions in order to minimize losses.
(2) Take profit: This is an upward limit above which sale is triggered. This procedure is carried out automatically once that fixed price is reached.
(3)Trailing stop: A trailing stop is a limit that is set bellow the price of a particular coin, and it is dynamic and very flexible because in automatically triggers a sale once the price falls to that set price and it protects a bullish run by selling positions and adjusting the take profit levels , based on the setup.
A whole lot of people the mistake they make is they don't really have a very established trading plan
Downvoting a post can decrease pending rewards and make it less visible. Common reasons:
Submit