Setting up a chart on tradingview platform is an easy process. To do this,
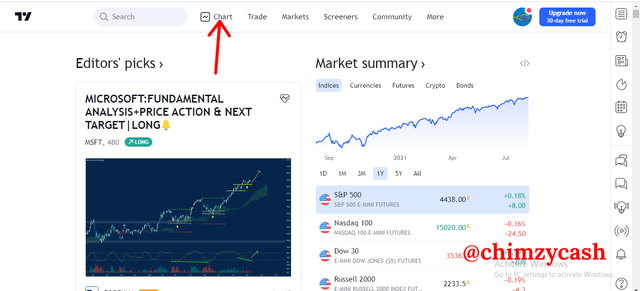
- After signing up on tradingview, on the navigation bar, click on the Chart.
.png)
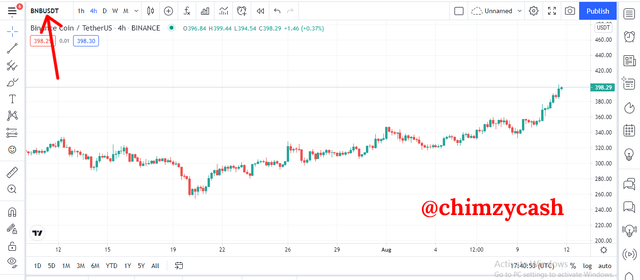
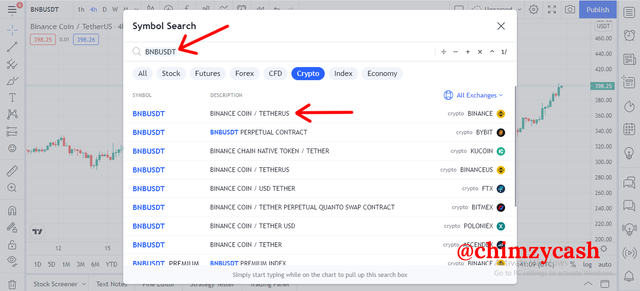
- To change the asset pair, click on the asset pair at the left and search for the asset pair of your choice. This will be the pair that will be analyzed on the chart.
.png)
.png)
On the chart interface, you can set up the chart interface to fit your needs. The default settings work well but tradingview allows users to make changes to the chart.
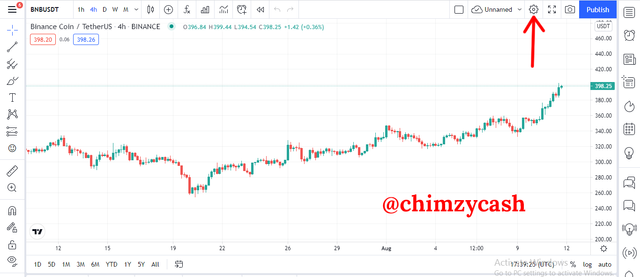
To access the chart settings, click on the gear icon. The chart settings has different parameters that can be changed. The main sections on the chart settings are; symbol, status line, scales, appearance, trading
.png)
- The Symbol setting allows users to make colour changes to the candlesticks and price lines on the chart. Also, users can turn on and off the different elements of candlesticks. Default setting works well.
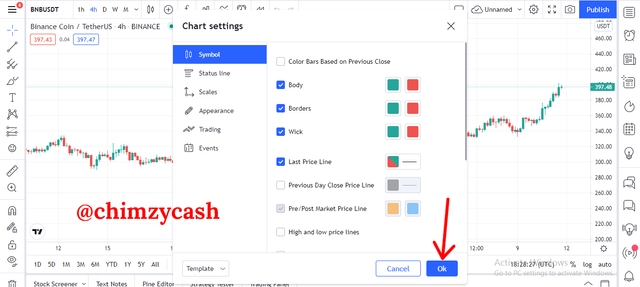.png)
- The status setting allows users to make turn on and off the different status line elements on the chart interface. Default setting work well.
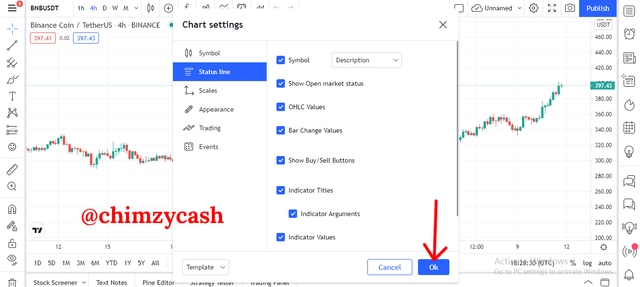.png)
- The scales setting allows users to turn on and off the different labels and make changes to the scales. Default setting works well.
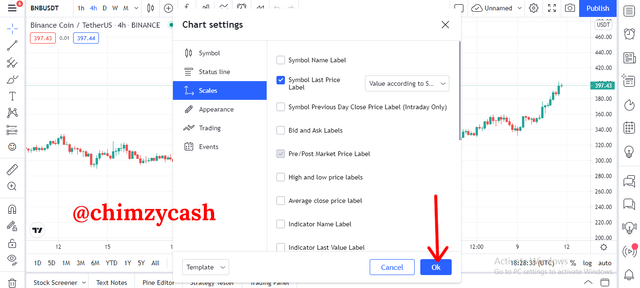.png)
- The appearance setting allows users make visual changes to the chart interface. Colours, text, scale lines, crosshair, watermark can be changed in the appearance setting.
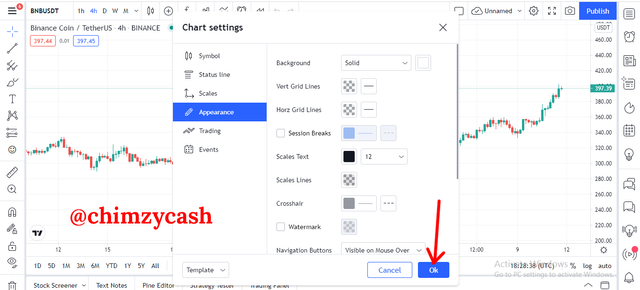.png)
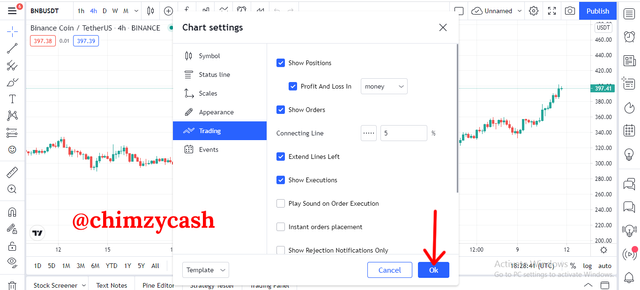
- The trading setting allows users to make changes and turn on and off the different elements for trading on tradingview. Elements such as buy and sell button, bid and ask, positions etc can be adjusted.
.png)
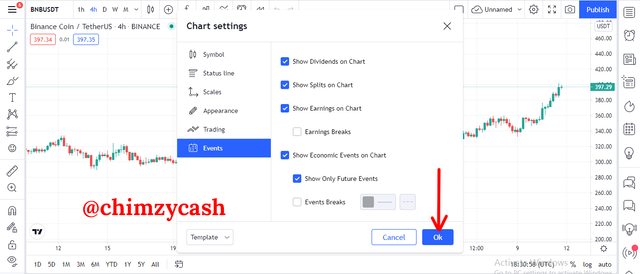
- The event setting allows users to turn on and off the different events elements such as dividends, earnings on chart etc.
.png)
The horizontal line tool
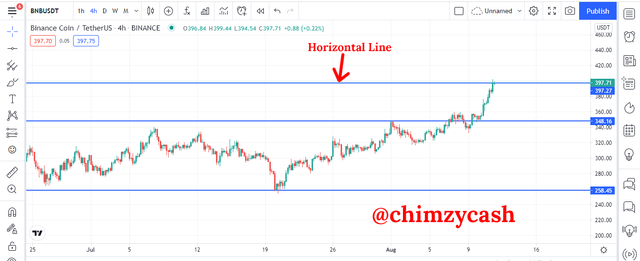
The horizontal tool is a smart drawing tool that is basically used to mark specific price points on the chart. This is a great tool that can be used to mark support and resistance price points.
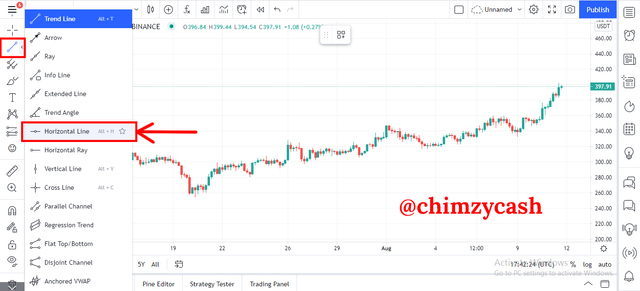
To use the horizontal line tool to edit the chart when performing technical analysis, double-click the second tool on the tool menu and select the horizontal line tool from the options.
After selecting the horizontal line tool, click on any price point on the candlestick chart to place the horizontal line. You can place as many horizontal lines as possible to mark different price points.
.png)
.png)
The Long position tool
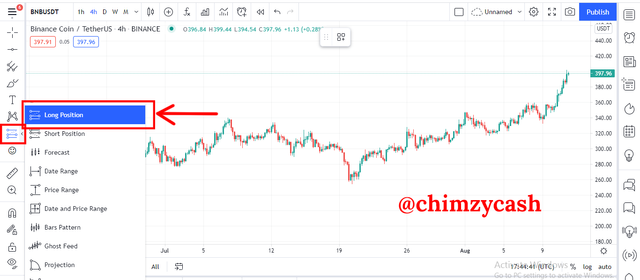
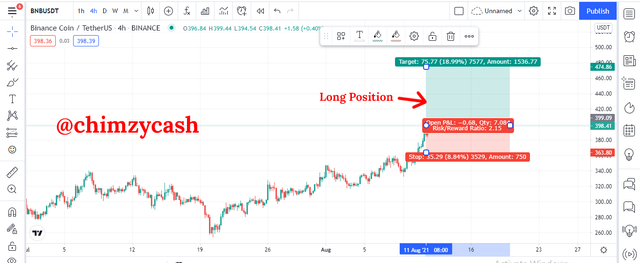
The long position tool is another smart drawing tool that is basically used to set a long position for entry point, exit point and stoploss. This tool is used to visually mark the predicted long position on the chart, determining the number of pips and risk:reward ratio.
To use the long position tool to edit the chart when performing technical analysis, double-click the seventh tool on the tool menu and select the long position tool from the options.
After selecting the long position tool, click on the entry point on the candlestick on the chart to place the long position. The long position tool can be scaled to set the different positions for entry, exit and stoploss.
.png)
.png)


Trading view is really something every trader needs to make use of in order to actually know how to trade
Downvoting a post can decrease pending rewards and make it less visible. Common reasons:
Submit