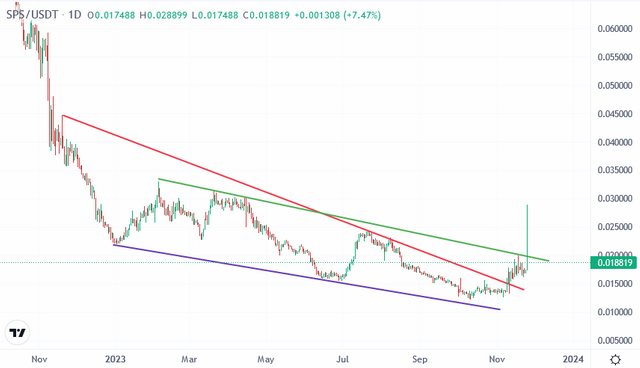
There was a falling wedge pattern SPS price chart coming from end of 2022. SPS price was under selling presssur by market conditions and game tokenomics..
Updating of Splinterlands game also effected the price of SPS.
I shared lots of price analysis for SPS and showed you falling wedge pattern is on SPS price chart.
There were two great resistance on SPS price chart. I showed them with green and red line.
Red line was broken up a few days ago. Green line worked as resistance a few days ago and It is broken up today!

Today, SPS price touched 0.028 USD where is the highest level since May 2023. It may be reversing time for SPS and It may enter bullish trend.
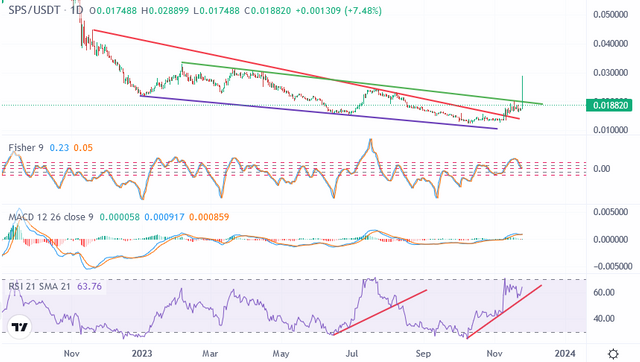
When we look at the indicators on daily SPS price chart, It says we may see bullish trend in a few days.
There is uptrend on RSI Indicator. It will be broken down in December. MACD Indicator is also reversing from the bottom on 0 level. It may reverse on the top when RSI support line broken down..
Fisher Indicator is at good level for today and It may reverse from the bottom and we may see bullish trend in a few days..

I am not so bullish for SPS price. Because, I am waiting for bearish trend in December for crypto market. That will effect SPS price and market will go down..
Bitcoin and lots of price charts show this trend reversing in December..
I am bullish after halving but we will be bearish trend until halving.
We will see...
Downvoting a post can decrease pending rewards and make it less visible. Common reasons:
Submit
@chorock Hello sir, how are you? Can you please check my profile what's wrong my last 2 post. I don't understand
Downvoting a post can decrease pending rewards and make it less visible. Common reasons:
Submit