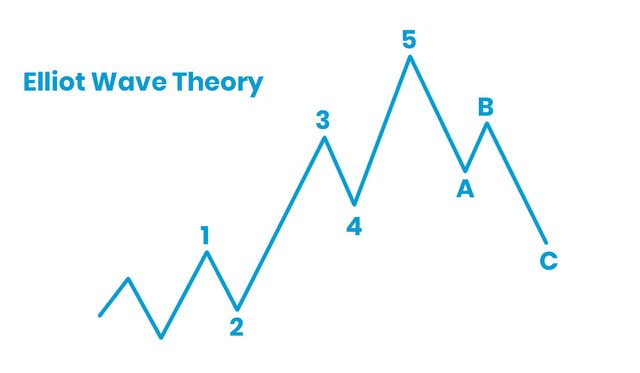
By looking at the cryptocurrency price chart, it is quite easy to spot the different Elliot waves patterns which comprises of both impulsive waves and corrective waves. Since the impulsive waves is made up of 1,2,3,4,5 numberings, and the corrective waves is made up of a,b,c lettering, both can be easy to spot.
Wave 1 is the first impulse wave. This first impulse mostly happens when the project is still in its early stage. It is considered the first wave when the bullish market begins. The first impulse wave can be caused by investors and market sentiments which causes a bullish movement.
Wave 2 is the wave that corrects the wave 1. It moves in the opposite direction of wave 1. The rule is that wave 2 cannot go beyond the beginning of wave 1. At this point, the market retest the previous low and market sentiments can cause the market to go in a downward direction. This is a great entry point for the massive bullish movement of wave 3.
Wave 3 is usually the largest wave in the sequence. As the cryptocurrency begins to gain more popularity and attention, a lot of investor jump in, then the price of the cryptocurrency begins to rise at a rapid rate.
Wave 4 is the wave that corrects wave 3 or go in the opposite direction of wave 3. Wave 4 downward move can be cause by people investors selling their coins to make profit which causes the price to retrace or pull back. For some, this is a good entry point to get ready for the next bullish movement.
Wave 5 is the last impulse wave. At this point, the sequence is completed and as the market prepares for the corrective phase.
Wave A is the first corrective wave in the bear market, however, it can be very tricky to identify the corrective wave. At this point, the market is still very much positive as people aren’t sure of the market situation.
Wave B is the wave that temporarily corrects wave A. At this point, many users are expecting the market to continue in the upward direction. At this point, the volume goes lower than the volume of wave A.
Wave C is the steady correction of Wave B, the price goes in a downward trend much quicker and the bear market is confirmed.
My thoughts on this theory
This is for me the best theory for determining the nest possible movement of the market. I like this tool a lot as it gives a general overview of the market movements based on noticeable and repetitive patterns. While this theory is great at what it does and has shown time and time again that the market always tend to follow a repetitive pattern, there is no certainty that the predictions will be accurate as there are a lot of factors that can influence the market movement. It is important not to rely fully on the Elliot waves signals to take action in the market as it can also give false signals.
Sometimes it can be very tricky or impossible to spot the correct impulse and corrective waves which can lead to misjudging the market and making a false analysis. Elliot waves are known for helping in technical analysis to determine market movements based on repetitive patterns, however, it can also cause inaccurate predictions if it is relied on. The cryptocurrency market can be unpredictable because of a lot of factors that can cause the market to move in any direction.

Yay!👍 We collecting more Crypto. Reshared your post🔁
Downvoting a post can decrease pending rewards and make it less visible. Common reasons:
Submit
Hi
I am glad you brought this up at this part of the market cycle. plenty of charts to look at and try to do some wave spotting and learning.
Downvoting a post can decrease pending rewards and make it less visible. Common reasons:
Submit