The Mayer Multiple indicator is an indicator developed by investor Trace Mayer, as a way to help investors have a proper perspective of the Bitcoin price, and through which it is estimated that speculative bubbles or the exhaustion of a downtrend can be identified. Let's see what this indicator consists of and what it tells us at the moment.

Source: edited image, original from pixabay.com.
Basically, the Mayer Multiple indicator corresponds to the Bitcoin price divided by its 200-period daily moving average, i.e., this indicator makes a comparison between the current price and its 200-day moving average, thus providing an estimate of how close or far the current price is with respect to the 200-day moving average (Interdax,com).
Basically, if the price is equal to the 200-day moving average the value of the indicator is equal to 1, if the price is above this average the index is greater than 1, while if the current price is below this average the index value is less than 1.
While this indicator does not directly say when to buy or sell, it places the current price of Bitcoin in a historical context that can give us a reference of when this asset is overvalued or undervalued.
How to interpret the Mayer Multiple Indicator?
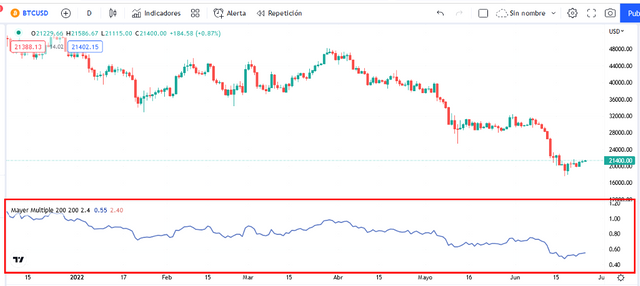
This indicator is shown as an oscillator at the bottom of the price chart, very similar to other oscillators such as the RSI.

Daily chart of the BTC/USD pair. Screenshot taken from Tradingview.com.
On the other hand, by historical references it is considered that a value above 2.4 represents the beginning of a speculative bubble around the price of Bitcoin, since subsequently a rapid depreciation of the price is observed, that is why we see traced range in the graph to establish a level of higher risk. It is also mentioned that historically this value has been high, averaging 1.41 (@TIPMayerMultiple),while values below 0.6 were only observed in previous bottoms (Interdax,com).
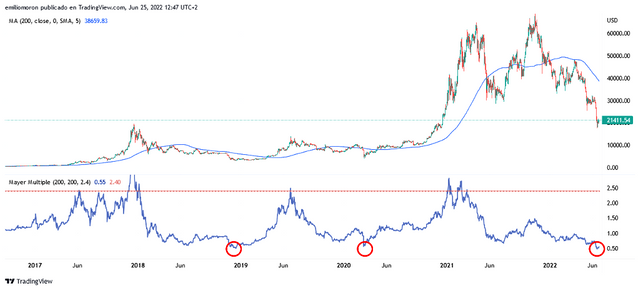
At the moment the Mayer Multiplo has a value of 0.52, a fairly low value that corresponds with the current market sentiment, and as we can see in the following chart, values as low as the current one have only been recorded in March 2020 and December 2018, and as we can notice, these previous lows marked the beginning of a bullish cycle.

Daily chart of the BTC/USD pair. Screenshot taken from Tradingview.com.
As you well know we cannot always rely on a single indicator, and we must make our own analysis considering all the aspects that at this time have moved the price of Bitcoin to such low values, however this indicator gives us a good reference on the historical context in which it is located.
Thanks for coming by to read friends, I hope you liked the information. See you next time.

You are not eligible to use the #fintech tag for support from SC05. You should join any of the club statuses. Thank you.
Downvoting a post can decrease pending rewards and make it less visible. Common reasons:
Submit
Hello dear @steemcurator05, I am participating in club5050, or are you referring to a different one?
Downvoting a post can decrease pending rewards and make it less visible. Common reasons:
Submit
@tipu curate
Downvoting a post can decrease pending rewards and make it less visible. Common reasons:
Submit
Upvoted 👌 (Mana: 2/6) Get profit votes with @tipU :)
Downvoting a post can decrease pending rewards and make it less visible. Common reasons:
Submit
Thanks my friend!
Downvoting a post can decrease pending rewards and make it less visible. Common reasons:
Submit