Hello and welcome to episode 09 of TA (Technical Analysis) Today we are diving into the AI Token!
To diversify my portfolio, I started exploring some different tokens in December and within a few days, I came across some great tokens related to Artificial Intelligence, out of which I liked Sleepless AI and Virtual the most and the chart pattern of Sleepless AI looked the most attractive at that time.

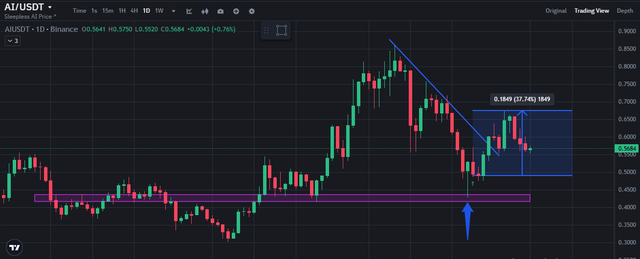
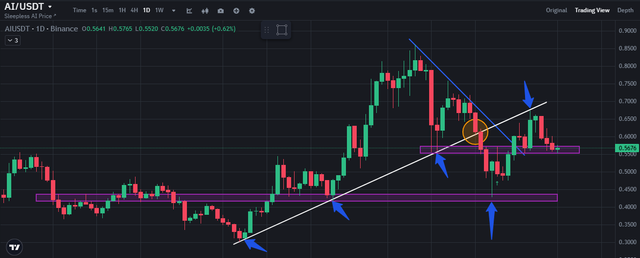
After seeing strong buying from key support on December 20, I created my first entry position in AI token on December 21 at 0.49 with strength confirmation on smaller timeframes. From there, the dominance of buyers broke the lower low structure and gave an upmove of more than 37% with proper bullish price action but instead of further continuation, the price has suddenly seen a lot of pressure in the last few days. However, after that recent rejection, I identified another important trendline, if I had identified this trendline earlier, I would have probably booked some profits around the recent high at 37%.

Well, the white trendline you see in the screenshot above is the trendline that was earlier acting as an important support and after a strong breakdown, is now acting as a resistance during the pullback. Anyway, now the price is once again trading at a support. If the bullish trend continues in this token, it can happen from here because now if the price sustains below this area, it can fall additionally by 20 to 25%.
If you look at my buy position, this token is still giving me a profit of more than 15%. The trade plan is simple, as I just told you now, if it shows further weakness from the current market price area, then for the time being I will take the profit I am getting and exit this trade and if from here it shows dominance of buyers once again, then I will hold it for a bigger target.
Upvoted! Thank you for supporting witness @jswit.
Downvoting a post can decrease pending rewards and make it less visible. Common reasons:
Submit