01 Explain the Concept of Divergence in Trading
Divergence trading is a kind of market signals, can be an early indication that this is the opportunity to buy or sell, but any indicator has a failure time, so still need to be combined with other indicators to verify the more accurate.
Generally we commonly used technical indicators and market price divergence, such as MACD indicator divergence, RSI indicator divergence and KDJ indicator divergence. There are two types of divergence:
- Regular Divergence
- Hidden Divergence
Conventional divergence means that as the price continues to move lower or higher, the indicator does not follow, but instead moves higher or lower.
- Regular Bullish Divergence: In a downtrend, the price lows continue to move lower, but the indicator lows move higher instead.
Regular Bearish Divergence: In an uptrend, the price highs continue to move higher, but the indicator highs move lower instead.
Hidden Divergence is when the indicator continues to move lower or higher, but the market price instead makes a higher low or lower high. - Hidden Bearish Divergence: Price formed a lower high, but the indicator continued to move higher
Hidden Bullish Divergence: price forms a higher low, but the indicator continues to move lower.
The simple summary is that as long as the price and indicator movement trend side of the reversal, we need to distinguish between the regular divergence and hidden divergence, regular divergence hidden is the market reversal signal, while the hidden divergence indicates that the market trend will continue.
02: Identifying Divergence with the RSI or MACD
MACD (Moving Average Convergence Divergence) is a popular technical analysis indicator used to identify potential trend sickness to generate trading signals.
The MACD indicator consists of three key components:
- MACD Line: This line represents the difference between two exponential moving averages, usually a short-term moving average and a long-term moving average. It reflects recent price action and provides a signal of a potential trend reversal.

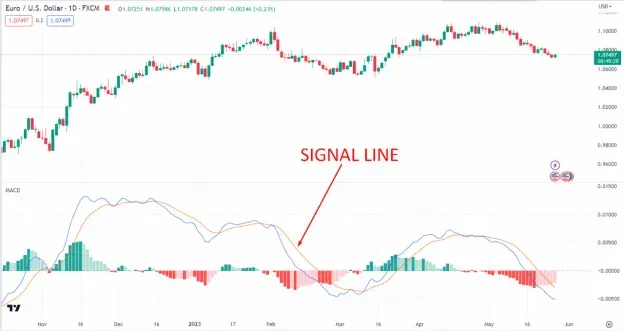
- Signal Line: A signal line is a smoothed moving average of the MACD line. It helps to confirm the direction of a trend and generates a trading signal when it crosses above or below the MACD line.
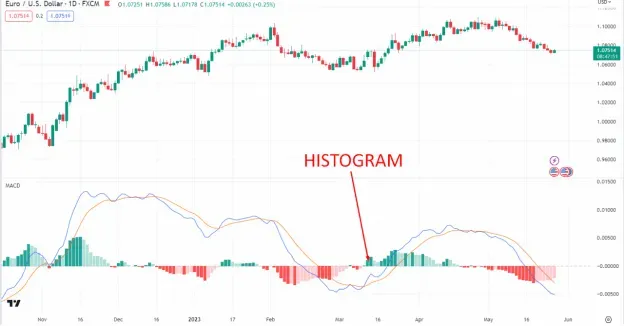
- Histogram: The histogram represents the vertical bars on the MACD chart. It visually depicts the distance between the MACD line and the signal line. Positive values indicate bullish momentum while negative values indicate bearish momentum.
03 Combining Divergence with Other Indicators
Understanding the MACD will enable you to use the indicator effectively in identifying potential trend reversals, confirming trend strength and generating trading signals. However, the MACD should be used in conjunction with other technical analysis tools to enhance the accuracy of your analysis results.
- positive divergence
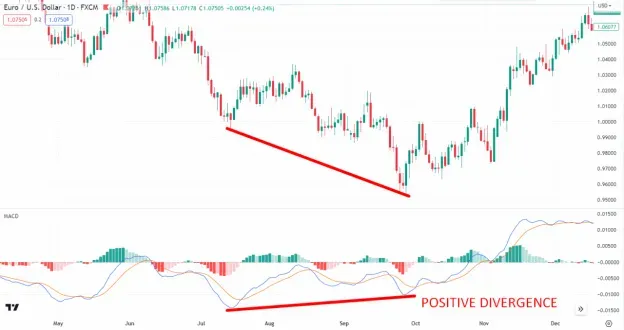
Positive divergence occurs when asset prices make lower lows, but the MACD indicator forms higher lows. This indicates a potential trend reversal and a bullish signal. For example if a stock's price is falling, making lower lows, and the MACD indicator shows higher lows, this could indicate that selling pressure is abating and prices are about to reverse to the upside.
- negative divergence
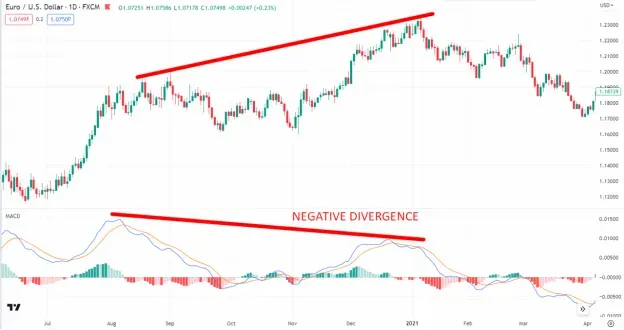
Negative divergence is the opposite of positive divergence. This occurs when asset prices make higher highs, but the MACD indicator forms lower highs. This indicates that the current uptrend may be weakening and the trend may reverse to the downside.
For example a stock price is rising, making higher highs, but the MACD indicator is showing lower highs, which may indicate that buying momentum is waning and the price may be correcting or reversing.
- moving average crossover
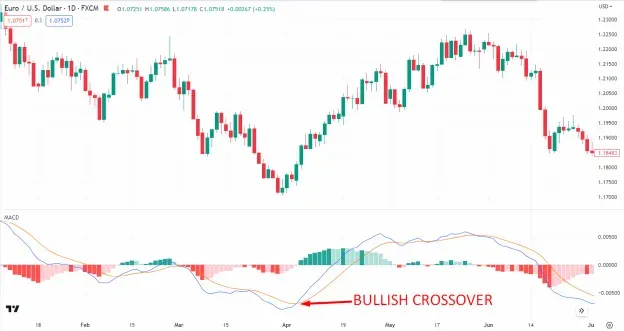
Moving average crossover is a widely used signal generated by the MACD indicator. When the MACD line crosses the signal line, it generates a bullish signal indicating a potential buying opportunity.
Conversely, when the MACD line crosses below the signal line, it generates a bearish signal indicating a potential selling opportunity. Traders often use these crossovers to confirm trend changes and enter or exit trades accordingly.
04 Developing a Divergence-Based Trading Strategy
Above I talked about the MACD line, so next I will talk about the MACD based divergence strategy.
Divergence occurs when the price of an asset moves in the opposite direction of the MACD indicator. A bullish divergence occurs when price forms a lower low and the MACD forms a higher low. This signals a potential upward reversal.
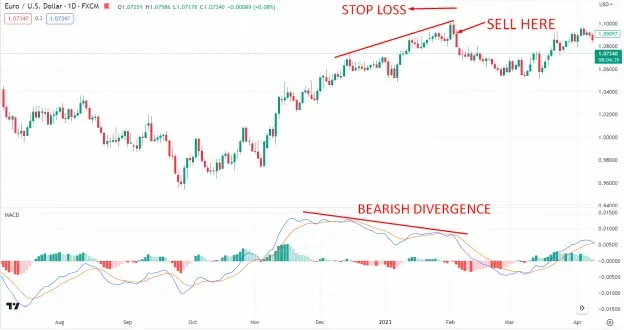
Conversely, a bearish divergence occurs when price forms higher highs and the MACD forms lower highs, indicating a potential downward reversal. You can predict trend reversals and adjust your trades accordingly by recognizing divergences.
05 Limitations and Best Practices of Divergence Trading
You can't be in a hurry to trade with divergences, because while you think you've caught a head start on a divergence signal, other institutions, banks, and traders are watching. When a divergence occurs, perhaps we can wait a little longer and trade after the signal is fully confirmed.
How can we further confirm a divergence trading signal?
- You can use the Stochastic Oscillator (Stochastic Oscillator) to cross the 2 lines as a confirmation of the divergence. It can also be verified by using the indicator to move out of overbought and oversold areas.
- It is also possible to verify a divergence signal by using a double trend line, where both the indicator area and the price area are drawn with corresponding trend lines, and the divergence signal can be verified when both trend lines are broken.
- Generally when divergence occurs, the price will form a top or bottom reversal pattern, such as a double top or double bottom.
- When using highs and lows to judge, note that they are major tops and bottoms, and you can ignore minor peaks between 2 highs, or minor valleys between 2 lows.
- And it is only valid if there are consecutive highs or lows, for example, when you see prices forming consecutive highs, don't look for a low trend