Bank a big winner in yoga pants only to apply it to a big loser in US utilities. Continue rotating from Thailand to China. A few more covered calls written

Portfolio News
Market Rally
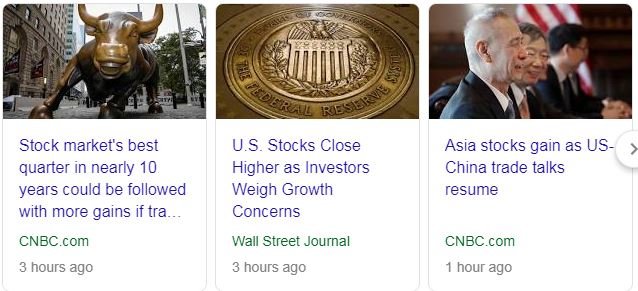
US markets move ahead on positive news about trade talks with China - well the team arrives in Beijing to talk more.
What a difference a day makes in yields.
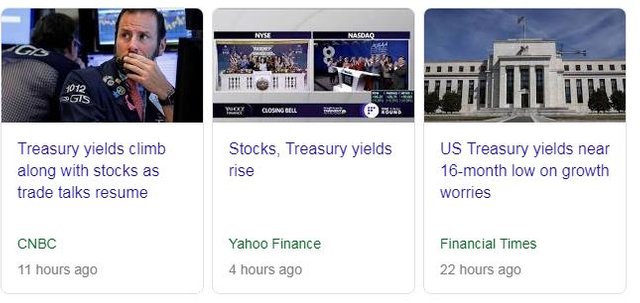
The resumption of trade talks with China cheered the bond markets up and yields rose. After all the drag on growth is the impact of tariffs on China. Fix that problem and life might go back to growth mode.
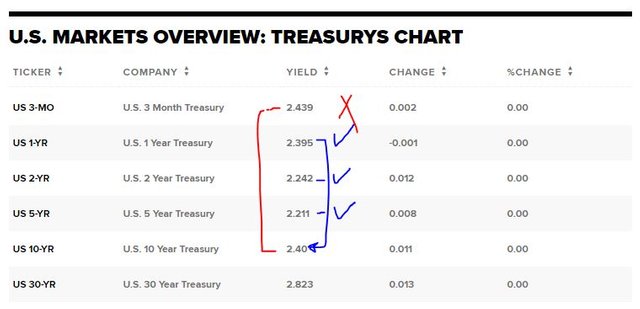
All the talk is about the inverted yield curve. What does than mean? Normally short term rates are lower than long term rates. The curve is inverted when short term rates rise faster than long term rates and go higher. There is a lot of panic about this and the media love to play it up. The benchmark rate difference (called a spread) is the 2 year - 10 year. This is currently in round terms 16 basis points positive. In fact, the 1, 2 and 5 years spreads are all positive and only the 3 month is negative.
Now 16 basis points is quite a big deal as this is not far off the size of a Federal Reserve rate change. A hike in rates would make the spread negative.
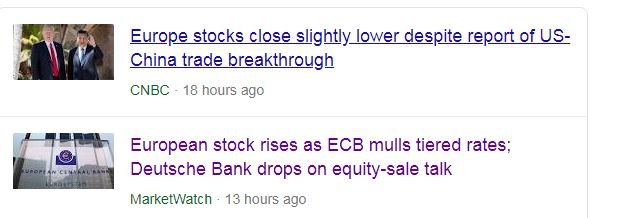
European stocks also moved ahead but driven more by confirmation from the ECB that they were considering tiered deposit rates to mitigate the effect of negative rates on bank incomes.
Of note is they would only consider this if things got worse - i.e., into recession.
https://www.marketwatch.com/story/european-stock-markets-climb-as-ecb-mulls-more-stimulus-2019-03-28
Bought
Xtrackers Harvest CSI 300 China A-Shares ETF (ASHR): China Index. Rotated out of Thailand into China. This is a progressive process of increasing exposure to China looking ahead to increased weighting in MSCI indices and progress on trade talks.
Sold
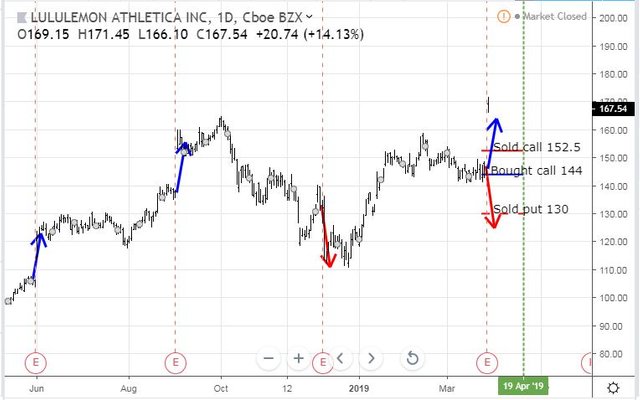
Lululemon Athletica Inc (LULU): US Clothing Apparel. Market loved Lululemon results with price jumping over 20% to $167.54. Results were based on strong holiday sales but more importantly excitement about the new menswear line. I closed out my call spread risk reversal entirely. I did close the bull call spread and decided for $5 I could take the risk of a major market correction out. Trade numbers were as follows: I received $0.28 to set up the trade and I achieved a net $7.89 on closing the trade. That feels like free money making money. Profits were applied to fix a problem trade - see below.
Quick update on the chart. The logic of the trade set up was to cover the very large swings that happen around earnings.
Well we got one of those big swings - a little bigger up than the prior blue arrow price scenarios. The price move for the day is the bar above the right hand blue arrow.
https://www.cnbc.com/2019/03/27/lululemon-fourth-quarter-2018--earnings.html
iShares MSCI Thailand Capped ETF (THD): Thailand Index. Rotated out of Thailand on election concerns into China A-Shares for 27% profit since June 2016. Overall profit from Thailand trade, including covered calls is 33% in this portfolio.
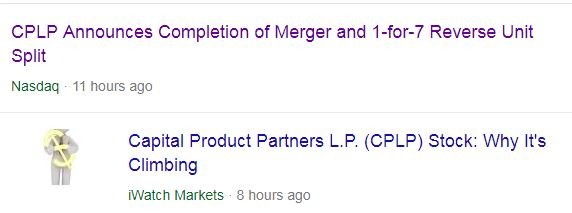
Capital Product Partners L.P. (CPLP) and Diamond S Shipping Inc (DSSI): Shipping. Capital Partners separated out its crude and product tanker businesses and merged it into Diamond S Shipping, a private company.
This makes DSSI a market leading crude and product tanker business and CPLP focused on its container shipping business. Fractional shares following the reverse split sold in both stocks for cash neutral outcome. I am now holding both CPLP and DSSI shares.
Swiss Re Ltd (SREN.VX): Swiss Insurance. Closed December 2019 strike 92 call option for 5.9% profit since June 2015. I did review all my Swiss Re options contracts. I have 2019, 2020 and 2021 expiries with strikes of 92, 96.71 and 100. With closing price of SFr 96.86 I am not convinced that price will get up and past SFr 100 plus premium - so I held off rolling contracts up. There are only strike 92 and 100 call options available for 2020 and 2021 - would love a 96 strike.
Shorts
Utilities Select Sector SPDR Fund (XLU): US Utilities. Partial close out for 14% blended loss since June/July 2018. This trade was set up as a way to ride rising interest rates. The change of stance from the Federal Reserve killed the trade idea - been a bit slow to make the exit.
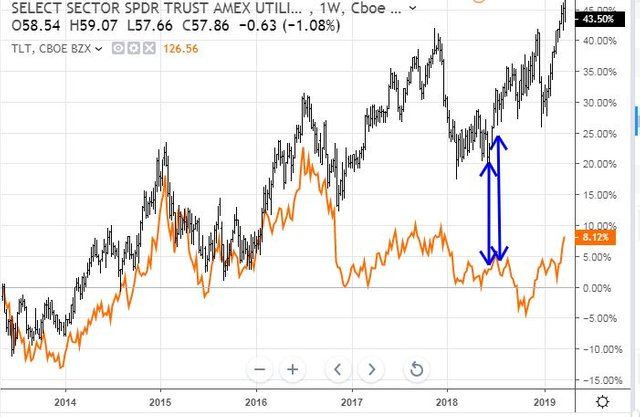
In TIB245, I set out the rationale for the short utilities trade. It is a 3 edged trade, one on rates, one on competition from solar and one on reduced demand from things like LED's. I also presented a chart covering rates with the trade idea being the gap between Utilities and Treasuries could close. The updated chart compares XLU to the 20 year Treasury ETF (TLT - orange line).
The arrows shows the gap at trade time. Basically the trade never worked as the rates play dominated. What is remarkable is the speed difference between the two curves since the December selloff ended.
All is not doom and gloom as I did buy municipal bonds fund (MYI) at the same time to fund the XLU dividends. They have gone up but not as fast.
Income Trades
3 more covered calls written
iShares MSCI Saudi Arabia ETF (KSA): Saudi Arabia Index. Sold April 2019 strike 34 calls for 0.90% premium (0.95% to purchase price). Closing price $33.00 (higher than last trade). Price needs to move another 3.0% to reach the sold strike (tighter than last trade). Should price pass the sold strike I book a 7% capital gain. Income to date amounts to 1.55% of purchase cost.
American International Group (AIG): US Insurance. Sold April 2019 strike 46 calls for 0.35% premium (0.23% to purchase price). Closing price $43.14 (new trade). Price needs to move another 6.6% to reach the sold strike (new trade). Should price pass the sold strike I book a 29% capital loss. I am holding AIG for the long haul and might as well grab income along the way.
CVS Health Corporation (CVS): US Healthcare. Sold April 2019 strike 58 calls for 0.39% premium (0.38% to purchase price). Closing price $54.05 (lower than last trade). Price needs to move another 7.3% to reach the sold strike (easier than last trade). Should price pass the sold strike I book a 5% capital gain. Income to date amounts to 0.6% of purchase cost. This trade replaces the strike 59.5 call option which expires tonight - double dipping here BUT I do have other stock covering the call if I have to deliver tonight.
Cryptocurency
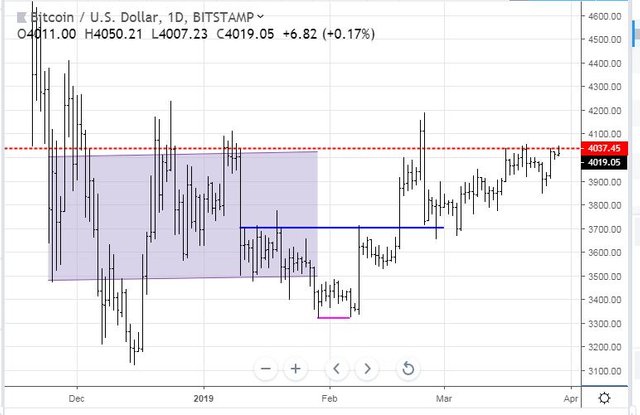
Bitcoin (BTCUSD): Price range for the day was $33 (0.8% of the high). Well, I got that one right. An inside bar and then making a go at reaching for resistance above.
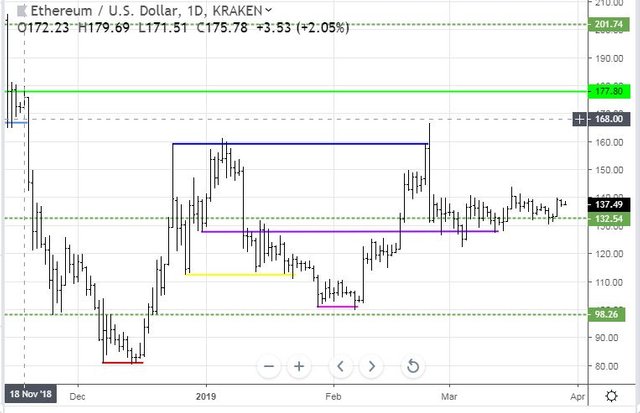
Ethereum (ETHUSD): Price range for the day was $3 (2.2% of the high). Also making an inside bar but not following it up with a push higher like Bitcoin.
CryptoBots
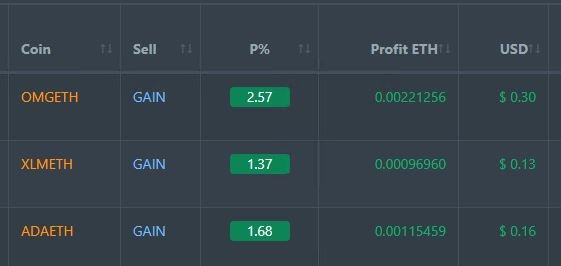
Profit Trailer Bot Three closed trades (1.87% profit) bringing the position on the account to 7.17% profit (was 7.09%) (not accounting for open trades). I converted holding of BTC to ETH to increase account allocation for trading (doubled it). I also added 2 additional coins to the whitelist (DASH and XMR) as they are in the top 15 coins.
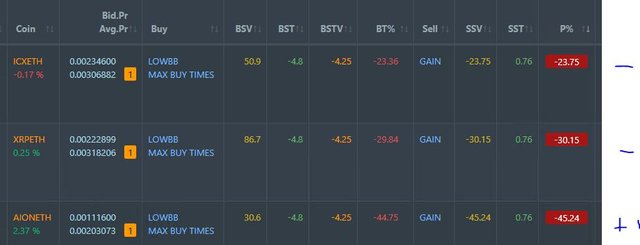
Dollar Cost Average (DCA) list remains at 3 coins - all quiet
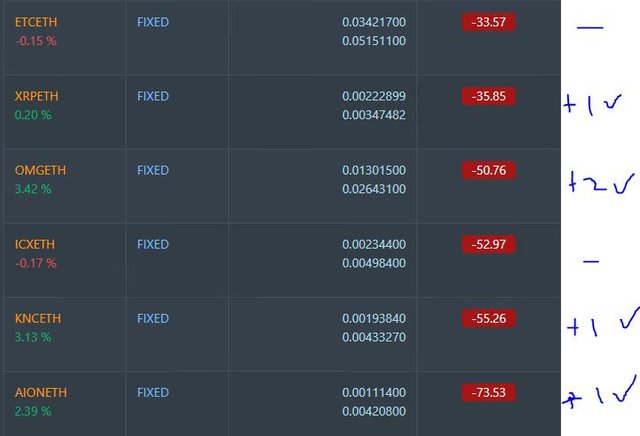
Pending list remains at 11 coins with 6 coins improving, 5 coins trading flat and zero worse.
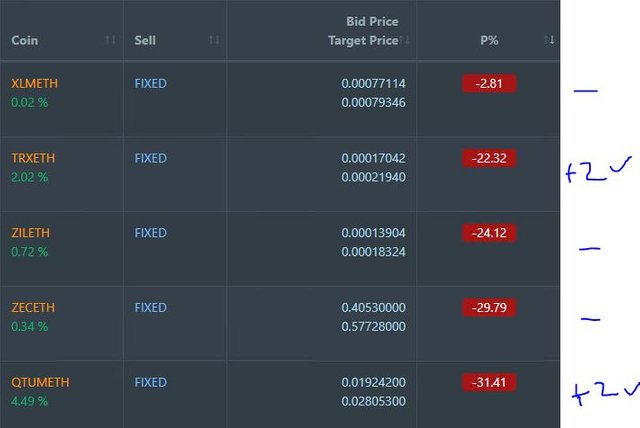
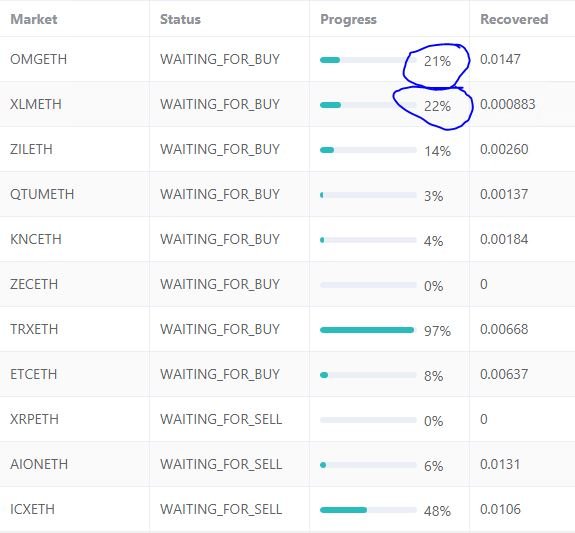
PT Defender continues defending 11 coins with closed defence trades on OMG and XLM.
From next week, I will only update section this weekly.
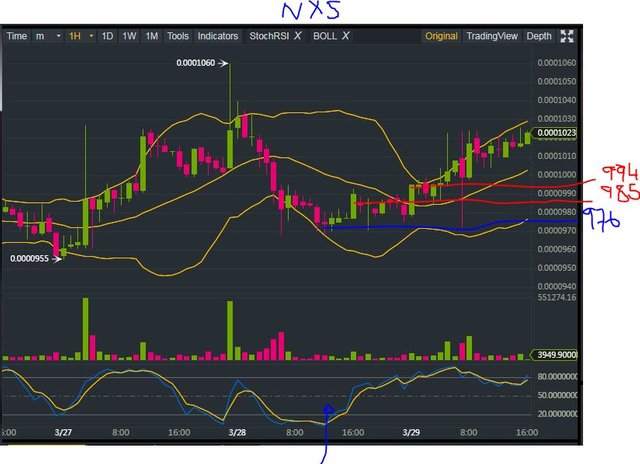
New Trading Bot Trading out using Crypto Prophecy. Trades closed on NXS for 0.87% and 1.64% profit. Chart shows entry point and two exit points = a classic Bollinger Band trade. It also shows the weakness of not having a trailing exit as there was quite a bit left on the table after 2nd exit.
Currency Trades
Outsourced MAM account Actions to Wealth closed out 7 trades on USDJPY, AUDCHF, AUDNZD, EURUSD for 0.89% profits for the day - only one loser on USDJPY. Trades open on AUDNZD and AUDCHF - all short AUD (0.16% positive)
Cautions: This is not financial advice. You need to consider your own financial position and take your own advice before you follow any of my ideas
Images: I own the rights to use and edit the Buy Sell image. News headlines come from Google Search. Treasury yields chart comes from CNBC.com. All other images are created using my various trading and charting platforms. They are all my own work
Lululemon image CC BY-NC-SA 2.0) by mag3737
Tickers: I monitor my portfolios using Yahoo Finance. The ticker symbols used are Yahoo Finance tickers
Charts: http://mymark.mx/TradingView - this is a free charting package. I have a Pro subscription to get access to real time forex prices
Crypto Prophecy provides a useful tool to identify oversold and overbought coins used for NXS trade - https://mymark.mx/CryptoProphecy
Trading: Binance offers a wide range of coins to trade, tight spreads and low fees if you use BNB to pay https://mymark.mx/Binance
March 28, 2019

Seems to me that the 3 months is just a play where investors are rotating out of the safety plays and going up the curve or into stocks. I would have to agree that the inverse has not been fully put into place although it is close.
Downvoting a post can decrease pending rewards and make it less visible. Common reasons:
Submit
The flows on the short term moves are massive. It feels like they designed to keep the brokerages and market makers in business.
Downvoting a post can decrease pending rewards and make it less visible. Common reasons:
Submit
Good call on lulu!
Posted using Partiko iOS
Downvoting a post can decrease pending rewards and make it less visible. Common reasons:
Submit
Thanks. CNBC Options Action team described it as sublime - their idea. I think I squeezed a bit more out of it as my trade was cash neutral to set up.
Downvoting a post can decrease pending rewards and make it less visible. Common reasons:
Submit