Hell week continues especially in Europe. Bitcoin tears ahead. Opportunities lie in semiconductors and a contrarian call in healthcare. Rather than exit technology I write covered calls a little earlier than normal.

Portfolio News
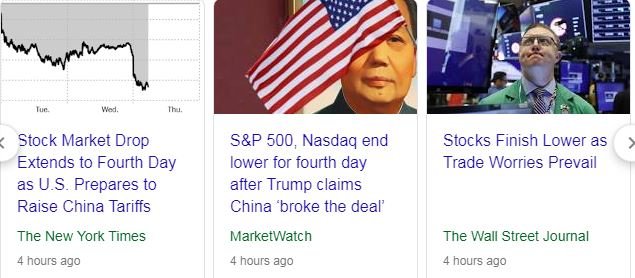
Tariff Tantrum
A new word emerges - hell week. It has felt like that
Watching the opening sea of red absorb the few pockets of green felt like that. The pain did ease off a little when Donald Trump said there was a chance of a deal being signed. The key might be in the way the tariffs get phased in with the pain spreading out a little over time. It was not pain all around with a few cloud computing names rising (WDAY, TWLO, VMW in my portfolios). Insurer, American international Group (AIG) rose strongly on good earnings.
Rocket ship of the day was TV streamer, ROKU with a 28% jump on its earnings propelled by massive subscriber growth. That $83.17 close brings price well over the 80 strike on the 65/80 bull call spread I am holding. Bonza - delta price is not working in my favour with the 65 strike (+73%) risen not as hard as the 80 (+84%) with only $6 differential in options prices given a $15 spread. The handsome part of the trade is the November 2019 45 strike put option I sold to finance the trade has collapsed too (-61%).
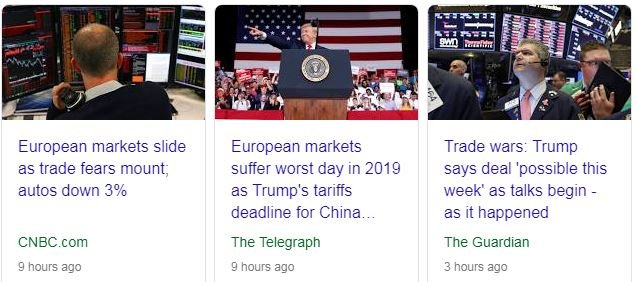
The biggest pain was felt in Europe especially in autos.
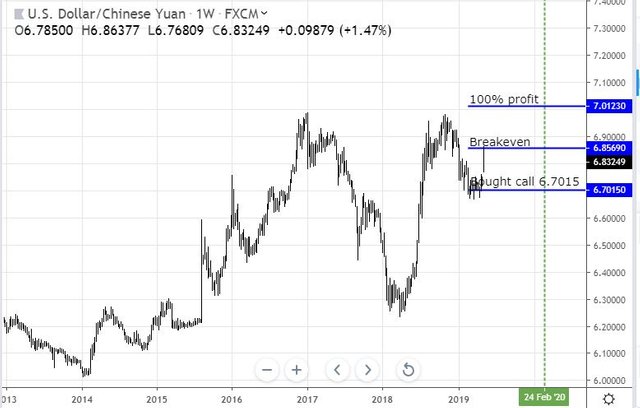
Good thing I resisted the talking heads suggesting Volkswagen and BMW a few short weeks ago. Big pain also for holders of Chinese currency - my options trade has just passed breakeven (I suspect better than that as implied volatility will have spiked too).
Bought
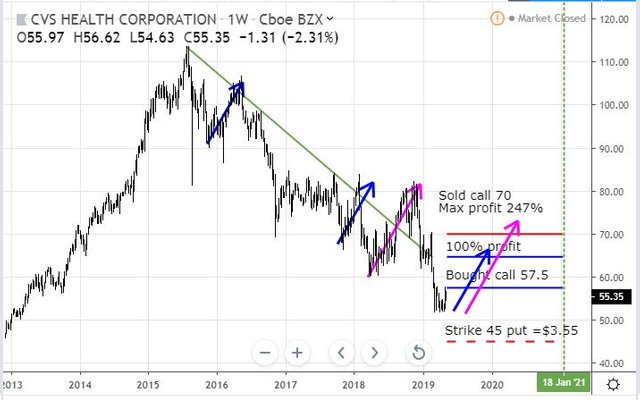
CVS Health Corporation (CVS): US Healthcare. Been looking at spreads here to leverage up a bottoming view. Bought January 2021 57.5/70 bull call spread for net premium of $3.60 offering maximum profit potential of 247%. Net premium is 6.25% of strike. With closing price of $55.35 bought call strike is one strike out-the-money. Let's look at the chart which shows the bought call (57.5) and 100% profit as blue rays and the sold call (70) as a red ray with the expiry date the dotted green line on the right margin
Price might have bottomed as it has held its ground in the week's sell off. I have modelled two price scenarios - the blue arrow one will take the trade to 100% profit but the trade needs a pink arrow to get to the maximum. I have also added in the potential sold put (45) as a dotted red ray - that put last traded at $3.55 which would absorb most of the paid premium. That level is below all the lows since 2013 but not as low as 2012 lows.
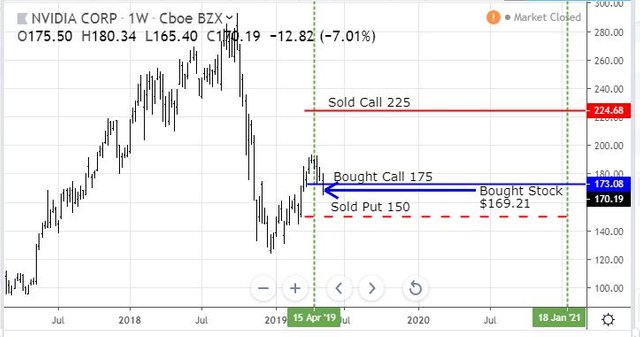
NVIDIA Corporation (NVDA): US Semiconductors. Jim Cramer nibbled a small position in Wednesday citing potential in data centres. I followed that nibble and see that he pushed another nibble post during the day. This trade is a little inconsistent with some of the trades I am already holding => calendar spread risk reversal at 175/225/150. With price sliding like this I could equally just wait for the chance that price does drop below $150 and I can buy there. The updated chart shows the new stock entry against the options contracts in place.
Holding a small parcel of stock is all about a long term view that might take longer than January 2021 to play out.
Income Trades
Jim Cramer has been trimming some of his technology holdings to release cash. I am holding this Technology ETF (XLK) - thought was to sell. I decided to use the market to test if there is a 4% bounce possible by June expiry - I wrote a covered call. If the China deal is signed a 4% recovery is easily achieved and I will exit 4% higher than today's close.
Technology Select Sector SPDR Fund (XLK): US Technology. Sold June 2019 strike 79 calls for 0.88% premium (1.59% to purchase price). Closing price $75.94 (new trade). Price needs to move another 4.0% to reach the sold strike (new trade). Should price pass the sold strike I book a 87% capital gain.
Cryptocurency
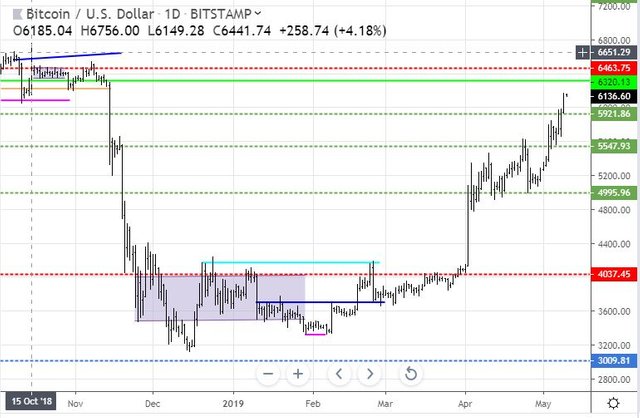
Bitcoin (BTCUSD): Price range for the day was $240 (4% of the low). Well I got that one one right - price did want to go higher and smashed through the $5921 level on the 3rd day after touching it.
This is a key part of the chart as price gets back to the congestion zone it was in at the end of 2018. I would not be surprised to see a consolidation around the level of the top pink ray before having a go at the ochre ray above.
The remarkable thing is this happened the day after the Binance hack. Normally an event like that smashes price. This tells me that the big sell off shook out most of the weak speculator hands.
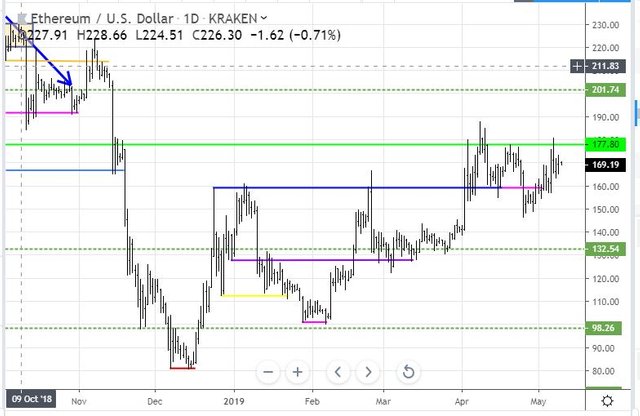
Ethereum (ETHUSD): Price range for the day was $8 (4.7% of the open). This feels different to Bitcoin with price just edging a little higher but not prepared to test the resistance level above.
CryptoBots
Profit Trailer Bot No closed trades. Bot is switched off as Binance has closed down all API's - need to create a new one.
New Trading Bot Trading out using Crypto Prophecy. No closed trades
Currency Trades
Outsourced MAM account Actions to Wealth closed out 2 trades on AUDNZD for 0.12% profits for the day. No trades open
Cautions: This is not financial advice. You need to consider your own financial position and take your own advice before you follow any of my ideas
Images: I own the rights to use and edit the Buy Sell image. News headlines come from Google Search. All other images are created using my various trading and charting platforms. They are all my own work
Tickers: I monitor my portfolios using Yahoo Finance. The ticker symbols used are Yahoo Finance tickers
Charts: http://mymark.mx/TradingView - this is a free charting package. I have a Pro subscription to get access to real time forex prices
Bitcoin: Higher Bitcoin price is a good time to get started with mining Bitcoin for as little as $25 http://mymark.mx/Galaxy
May 9, 2019
