Good morning traders, i hope everyone is ready to tackle the new week. Just a glance at the market fundamentals and there is nothing overly negative to see, rather a ray of light for a worldwide crypto pickup. It's not gonna be instant, it's not going to be easy, but here we are at the dawn.
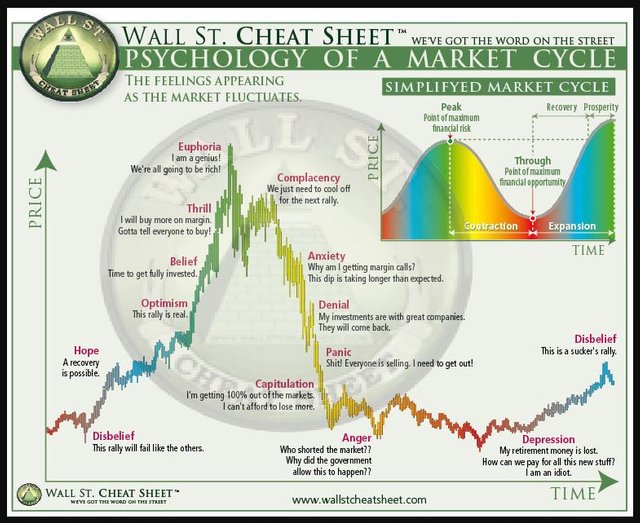
Lets start with the graph that has been on thousand screens and more, referred to a countless number of times and yet, it still works, if you take a step back and observe in a calm manner. It's the Wall Street cheat Sheet:
wallstcheatsheet.com via medium.com
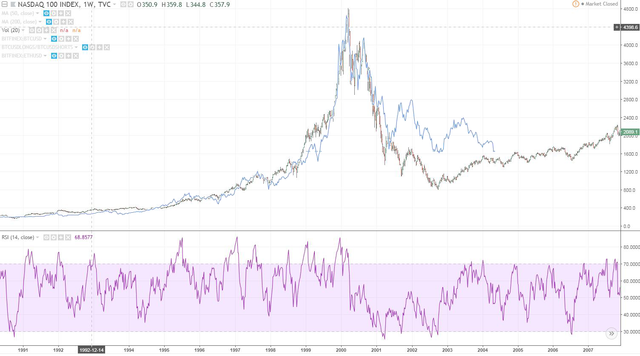
Pictured is the Nasdaq Composite Boom and Bust cycle, that took place roughly from 1995 until 2002. After 2002, NDX (Nasdaq 100 Index) never looked back and is still going strong, representing innovation, trust, greed and FED manipulation - you name it, it's there. But pay attention, i named innovation first - without innovation, pushing the indexes to their highs could have proved to be a futile task.
Feel free to check the chart yourself at tradingview.com. Click "Interactive chart", select a weekly or monthly chart and scroll back jsut a bit.
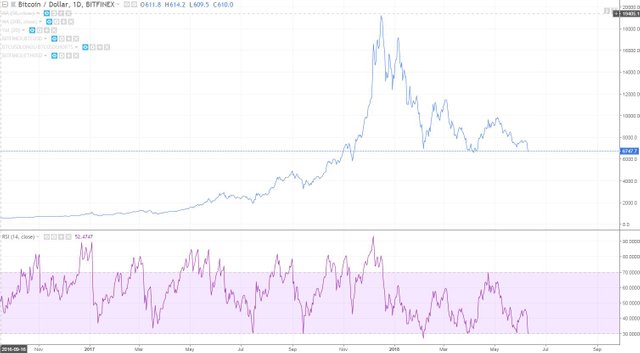
The same has happened to our dear beloved Bitcoin. What started with "Disbelief", peaked with "Euphoria" and was followed by "Capitulation". Are we currently in the "Depression" phase? Sentiment is changing. Market cycles is a well-known thing and at the end of cycles, we always rinse and repeat.

No, not these cycles. Market cycles. Read on below
Here's the Bitcoin chart i'm referring to:
Final stages of a cycle via tradingview.com
So let's grab our favorite photo editing program and overlay these two charts (below). Looks eeriely similar, doesn't it? I remember looking at these charts a few months ago and seeing that the bottom was close but still off - most of us were in denial phase back then. We know the market will go lower, but we hope not :)
Bitcoin (blue line) overlaid the Nasdaq historic pop:

Denial = HODL
Anger = lizard people want to see the world burn
Will the last phase be an extended sideways movement or will we drop more? As you see, the chart seems a bit open to interpretation, but one thing is certain - we are at the last phases of the cycle.
So, as the cryptohype is fading away - people are opening their eyes and seeing that cryptos are not just an insane store of value, but instead they can be used as an utility. Decentralized ledgers, immutable blockchain tech. If you take a step back and dig really in, you can find which cryptos and tokens solve the isses we really need solving. Do we need a Cash or Classic version of each crypto?
Best time to pick up some more if you find the correct ones. The hype will never be gone completely but balance itself out. The "Disbelief" and "Optimism" will come. Whether its now, soon, or further away, we can not know. But the cycle has run most of it's course.
Materials:
medium.com/@rontong
ethereumworldnews.com
Still not selling your vote to Minnowbooster to earn SBD? Do it now
Title image from pixabay


Are you looking for Minnowbooster, Buildteam or Steemvoter support? Or are you looking to grow on Steemit or just chat? Check out Minnowbooster Discord Chat via the link below.

buildTeam.io


What do you think about the scenario some are anticipating of going very low to $2500-$4000 as a "true bottom?" After all, it's hard for some of us to be truly desperate yet, if we bought BTC below $1k.
The bear market in 2013-2015 lasted for nearly two years. I'd love more than anything to see the disbelief phase start soon, but I'm really starting to wonder.
Downvoting a post can decrease pending rewards and make it less visible. Common reasons:
Submit
Entirely possible, even some basic shallow glance at the chart shows 4000 might be the case if we plot out these measured moves (equal repeating legs down as recent ones - but the legs do seem to get smaller). But what grabs my eye, is that the Relative Strength Index on H4 is the lowest, since 2016, when BTC was $350. Still haven't seen any good short-term capitulation volume, unfortunately. 2000 BTCUSD would be quite extreme though.
Downvoting a post can decrease pending rewards and make it less visible. Common reasons:
Submit
Bitcoin is shaking the believes now, hurting people like me with every drop in the value.
Downvoting a post can decrease pending rewards and make it less visible. Common reasons:
Submit
All we can do right now is believe in the political economy of the tech, and foresee the decades of historical TA that will be done in the wake of this insanely convoluted market. Being an early adopter comes with a burden I'm not sure many current investors are willing to face.
Downvoting a post can decrease pending rewards and make it less visible. Common reasons:
Submit
Thank you for inspiring words!
Downvoting a post can decrease pending rewards and make it less visible. Common reasons:
Submit
So..your saying its the fucking lizard people?
I knew it!
ha ha ha, awesome post man
Downvoting a post can decrease pending rewards and make it less visible. Common reasons:
Submit
Good post for raising morals.
In every war - the Moral is in fact the strongest weapon.
Downvoting a post can decrease pending rewards and make it less visible. Common reasons:
Submit
very unbelievable market situation. this big dip made so many traders frustrated and hopeless. now i think that upcoming days till at the end of june and first week of july BTC go more down and should be better position in mid july. So we should never lose our hopes, stay hopeful and think positive. Thanks @furious-one for updating the market statistics and whole scenario with graph.
Downvoting a post can decrease pending rewards and make it less visible. Common reasons:
Submit
So what were the good news and bad news?
Downvoting a post can decrease pending rewards and make it less visible. Common reasons:
Submit
The market will rise again. The banks can't win this fight.
Downvoting a post can decrease pending rewards and make it less visible. Common reasons:
Submit