Statistical package for social sciences, or SPSS (also known as PASW) is a software that is widely used by behavioral scientists, such as psychologists, psychiatrists, anthropologists, and other researchers in different fields of social sciences and marketing to analyze their statistical data.
The start-up window of SPSS is shown below which allows you to choose from the different options.

Type in data - This option is chosen when you want to type in your own data from your questionnaires or you want to copy-paste the data you collected using another software, such as E-Prime.
Run an existing query - If you already have a data file on your computer, then click on 'run an existing query' to open it and start running the analyses.
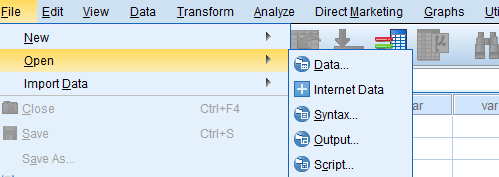
Another way to open an exisiting data file is to click on File --> Open --> Data.

It is recommended to save your data files on the hard drive of your computer. Sometimes, when you work on the files directly from external disk / USB drive, the file may crash and you may lose any unsaved work. Furthermore, because the work is not saved automatically like in some word processing software, you need to save your work manually every time you make changes to your file.
Saving the data, opening a new file, naming and renaming a file, etc, all works the same way as in many programs.
The SPSS data files are identified by .sav extension.
SPSS Windows
The three important windows of SPSS are:
- Data Editor
- Viewer
- Syntax Editor
Data Editor
It is the first window you see when you start SPSS. It is the data editor where you enter your data or work on already-existing data, or set your variables.

Data Editor has further 2 windows : (i) Data View, where you enter your data, and (ii) Variable View, where you name and label your variables and set their type, width, decimals, and other parameters.

When you click on data view, you see the following type of window:

The 'var' is for variable, such as age, gender, education, smoking status, or anything you want to measure.
In the Variable View, you can change this numeric name 'var' to the exact variable name and also label it and set other parameters.

Please note that in the Name, you cannot use space between words, and that's why there is label, where you can briefly describe your variable.
The image below shows the data view after you name your variables in the variable view:

Viewer
When you run your analyses, Viewer window will open and display the output or the results of your analyses. To see how the output file looks, we will calculate the mean, minimum and maximum values of our data about the age of the study participants.
The image below shows the age of our 20 research participants. The data is entered in the data editor.

And, here is the output, showing the total number of the participants (N), the age of the youngest participant (Minimum), that of the oldest participant (Maximum), and the average age of the participants (Mean)

In this example, we see that there are 20 participants in the study, the youngest being 18 years old and the oldest is 27 years old, and the average age of the participants is 22.65 years.
The SPSS output files (Viewer files) are identified by .spv extension.
Syntax Editor
It wouldn't be wrong if we call this window the savior window . When you run the analyses, you get 100s of output files. If you, later, due to some reason make changes in your data file and want to run the analysis again, it will be nearly impossible to run the analysis in the same order in which you ran it initially or to repeat the original analyses. With the syntax file, you save the commands of your analysis, and with a simple click, you reproduce the whole results. The commands are produced automatically by SPSS. You do not need to know the coding.
The image below shows the syntax file:

The syntax produced by running the analyses is as follows:
DESCRIPTIVES VARIABLES=Age
/STATISTICS=MEAN STDDEV MIN MAX.
It shows that the analyses that will be conducted will show descriptive statistics, and the variable that will be assessed is Age. The descriptive statistics that will be calculated are Mean, Standard Deviation, Minimum, and Maximum.
The SPSS syntax files are identified by .sps extension.

All images used in this post are original, screenshotted by me.
Congratulations @analyse! You have completed the following achievement on the Steem blockchain and have been rewarded with new badge(s) :
You can view your badges on your Steem Board and compare to others on the Steem Ranking
If you no longer want to receive notifications, reply to this comment with the word
STOPDo not miss the last post from @steemitboard:
Vote for @Steemitboard as a witness to get one more award and increased upvotes!
Downvoting a post can decrease pending rewards and make it less visible. Common reasons:
Submit
Hello,
Your post has been manually curated by a @stem.steem curator.
We are dedicated to supporting great content, like yours on the STEMGeeks tribe.
Please join us on discord.
Downvoting a post can decrease pending rewards and make it less visible. Common reasons:
Submit