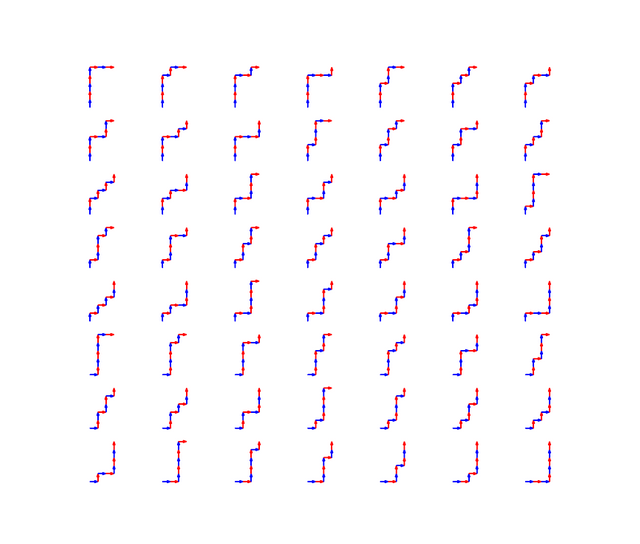
If you start at (0,0) and can take one step at a time either north (0,+1) or east (+1,0), how many different ways are there to get to (3,5)?
I wanted to augment this answer on Quora with a visual representation of all the lattice paths originally given in textual form.
A quick and dirty way of generating all the possible paths in Python is this two-line solution:
import itertools

allPaths = [ "".join( x ) for x in itertools.product( "NE", repeat=8 )
             if x.count( "N" ) == 5 and x.count( "E" ) == 3 ]
This is by no means the most efficient way, but it suffices for small values. There should be (5+3) choose 3 = 56 such paths.
I chose to graph them with matplotlib, which made it pretty easy to do one subplot per path.
Problems I encountered:
- Arrowheads extending beyond x=0 or y=0 got trimmed. I solved this by moving my starting position up and to the right.
- matplotlib tried to scale each subplot to the full width and height of the box, but this meant that the arrows were no longer the same length. I used
ax.set_aspect('equal', 'box' )to keep the aspect ratio equal. - Each graph is small enough that the arrowheads don't really stand out. I tried playing with the sizes without much success, and settled on alternating colors instead. I'm not entirely happy with red + blue, but green + blue didn't have much contrast.
Plot

Source Code
import matplotlib.pyplot as plt

length = 0.18
width= 0.001
head_width = 0.05

def drawPath( ax, path ):
    x = 0.0 + head_width
    y = 0.0 + head_width
    color = "blue"

    ax.set_aspect('equal', 'box' )
    for d in path:
        if d == "N":
            dx = 0.0
            dy = length
        else:
            dx = length
            dy = 0.0
        ax.arrow( x, y, dx, dy,
                  width = width,
                  head_width = head_width,
                  color = color,
                  length_includes_head = True )
        x += dx
        y += dy
        if color == "blue":
            color = "red"
        else:
            color = "blue"

for i, p in enumerate( allPaths ):
    ax = plt.subplot( 8, 7, i + 1 )
    ax.axis( "off" )
    drawPath( ax, p )

plt.show()
This post has been voted on by the SteemSTEM curation team and voting trail in collaboration with @curie.
If you appreciate the work we are doing then consider voting both projects for witness by selecting stem.witness and curie!
For additional information please join us on the SteemSTEM discord and to get to know the rest of the community!
Downvoting a post can decrease pending rewards and make it less visible. Common reasons:
Submit
Congratulations @markgritter! You have completed the following achievement on the Steem blockchain and have been rewarded with new badge(s) :
Click here to view your Board of Honor
If you no longer want to receive notifications, reply to this comment with the word
STOPDownvoting a post can decrease pending rewards and make it less visible. Common reasons:
Submit