OZ, IMO your charts are a little messy for my liking, with the numerous lines of support and all retracements, however for using multiple timeframes and NOT using 'garbage' indicators (MACD, Stoch's, Momentum, etc) I commend you and upvote you.
Also, your first chart made me see that STEEM is likely doing an ascending triangle pattern with 0.0068 as the primary resistance/breakout point and with today's low, 0.004'ish, as the likely 'must hold' support line.
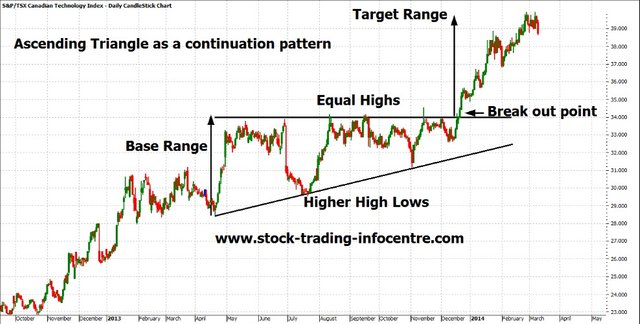
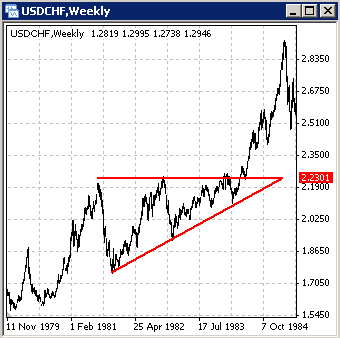
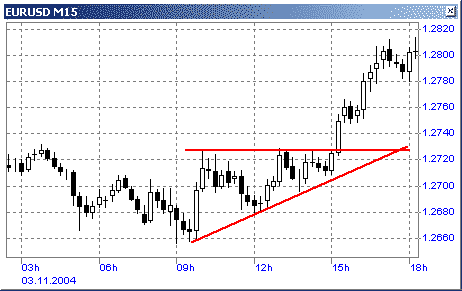
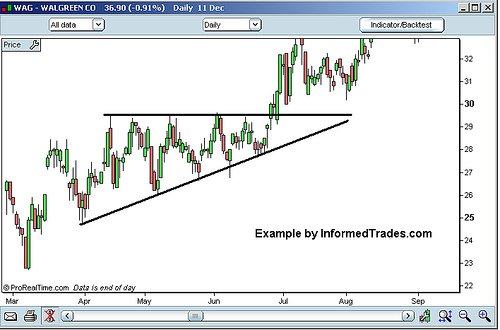
More often than not the ascending triangle is bullish continuation pattern and it results in much higher prices.
I've collected a handful of good example charts across multiple asset classes here from the vast interwebs showing ascending triangle formations breaking out. IMO STEEM is quite bullish here....

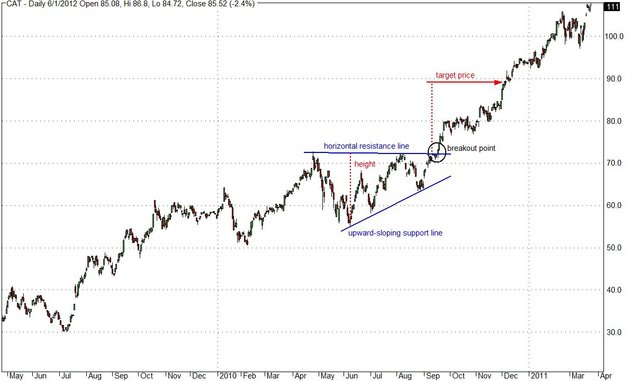
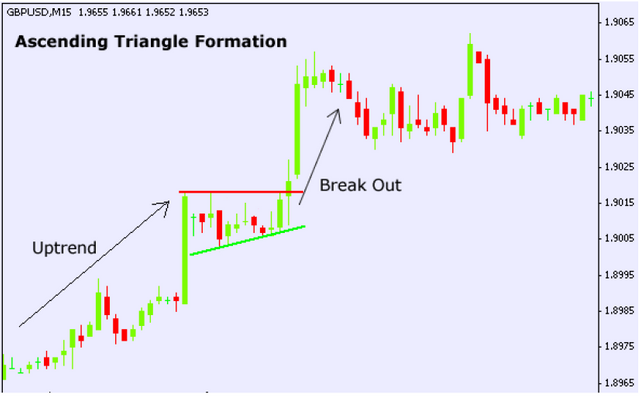
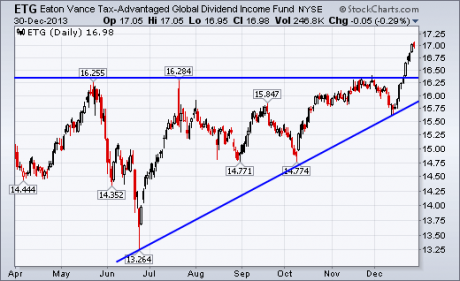
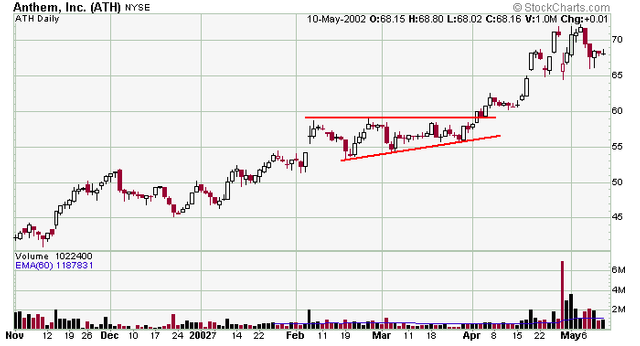
nice market
Downvoting a post can decrease pending rewards and make it less visible. Common reasons:
Submit
Good !

Downvoting a post can decrease pending rewards and make it less visible. Common reasons:
Submit
candlestick pattern
Investors can also psychological
take a moment
we see the future :)
Downvoting a post can decrease pending rewards and make it less visible. Common reasons:
Submit
I agreee they are messy I defo agree there:) but i will work on my charting skills, that is the goal :) to gett better as time goes by :)
My charting is nowhere near of being what I want it to be ;)
Thanks for the critics! alot!
Downvoting a post can decrease pending rewards and make it less visible. Common reasons:
Submit