What Will I Learn?
- Use of dc.js
- Different Charts/Graphs through dc.js
- Example Codes
Requirements
- Knowledge of HTML and CSS
- Intermediate Level JavaScript
Difficulty
- Intermediate
Tutorial Contents
- Introduction to dc.js
- Dependency
- Download and Use
- Build Charts/Graphs
Introduction to dc.js
dc.js is a JavaScript Library that allow you to develop graphs/charts, and highly interactive Dashboards. dc.js builds on d3.js and use d3.js to render charts in CSS friendly SVG format. By using this library you will be able to develop bar chart (histogram), pie chart, row chart, line chart, bubble chart, geo choropleth chart, and others. You can link the charts to each other to make a well connected charting interface for your work.
This JavaScript library is really a powerful tool for data visualization and analysis on the web. Here in this tutorial we'll try to cover some basics of dc.js that will help you to move on with dc.js.
Dependency
dc.js didn't works alone, it require crossfilter.js and d3.js to work.
crossfilter is also a JavaScript library released by Square, allow you to explore large multidimensional datasets. It aggregates and filter raw data extremely fast (<30ms). It doesn't have its own user interface, so it combine to work with d3.js and Google Visualization API. It’s really easy to get your raw data into crossfilter.js by using JSON data format.
D3 also known as Data-Driven Documents or d3.js, a JavaScript Library for data visualization, allow you to present raw data into a more visual form using SVG, Canvas and HTML5 and CSS standards. It is the more powerful library of JavaScript as to visualize data in graphical format as compared to above mentioned.
So, these two libraries are our helper libraries in using DC library. Let's move to work.
Download and Use
dc.js is an open source library, so you can easily get its source code from Github. Click on the link provided and download whole library. Once you have it on your computer, extract it, here from the extracted folder we just need four files to start our basic work. These files are
dc.js
dc.css
The above two files you can find in outside in the project but the other two, open web folder and then open js folder here you'll find
crossfilter.js
d3.js
Copy these four files and paste in your project folder and link these files into your project file.
<script  src="d3.js"></script>
<script  src="crossfilter.js"></script>
<script  src="dc.js"></script>
Now, we are able to work with dc.js, So, lets start.
Build Charts/Graphs
Once you've setup environment to work with dc.js open your project files start building charts with us. First we'll build Bar Chart, follow us.
Bar Chart
To develop any chart you need some raw data, for which you want to build a chart. it should be in JSON format. Here in the following example we copy the JSON data from crosfilter.js. You can use this or your own data to move with the example.
<html lang="EN">
    <head>
      <meta charset="utf-8">
      <title>DC template</title>
      <link rel="stylesheet" type="text/css" href="dc.css" />
      <script type="text/javascript" src="d3.js"></script>
      <script type="text/javascript" src="crossfilter.js"></script>
      <script type="text/javascript" src="dc.js"></script>
    </head>
    <body>
        <h1>Bart Chart By Total Payment</h1>
        <div id="barChart"></div>

        <script type="text/javascript">

               // JSON data from crossfilter.js
          var paymentsRecord = [
          {date: "2011-11-14T16:17:54Z", quantity: 2, total: 190, tip: 100, type: "tab"},
          {date: "2011-11-14T16:20:19Z", quantity: 2, total: 190, tip: 100, type: "tab"},
          {date: "2011-11-14T16:28:54Z", quantity: 1, total: 300, tip: 200, type: "visa"},
          {date: "2011-11-14T16:30:43Z", quantity: 2, total: 90, tip: 0, type: "tab"},
          {date: "2011-11-14T16:48:46Z", quantity: 2, total: 90, tip: 0, type: "tab"},
          {date: "2011-11-14T16:53:41Z", quantity: 2, total: 90, tip: 0, type: "tab"},
          {date: "2011-11-14T16:54:06Z", quantity: 1, total: 100, tip: 0, type: "cash"},
          {date: "2011-11-14T16:58:03Z", quantity: 2, total: 90, tip: 0, type: "tab"},
          {date: "2011-11-14T17:07:21Z", quantity: 2, total: 90, tip: 0, type: "tab"},
          {date: "2011-11-14T17:22:59Z", quantity: 2, total: 90, tip: 0, type: "tab"},
          {date: "2011-11-14T17:25:45Z", quantity: 2, total: 200, tip: 0, type: "cash"},
          {date: "2011-11-14T17:29:52Z", quantity: 1, total: 200, tip: 100, type: "visa"}
        ];

        </script>

    </body>
</html>
Take the raw data in JSON format paste it in your project file as above in the code.
After that feed this data to crossfilter object to process this data.
var facts = crossfilter(paymentsRecord); we named it as facts, each row in JSON data called fact.
You can also check this data in the console writing this line console.log(facts);
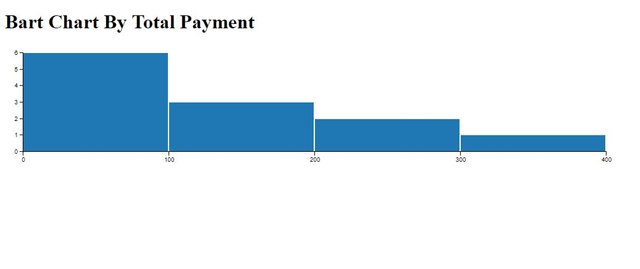
Now we'll have to create a dimension of our data, It means, if you want to know how many total payments you've made, for this we need to create a dimension. You can create any dimension of your data. For this write the code, here is the dimension by total.
var dimensionByTotal = facts.dimension(function (d){ return d.total;});
Then we grouped our data with the help of dimension we just created. It means if you want to know how many payments are done of the each amount (how many $100
payments). As you can see in our data there are six $90 payment and two $200 and so on. To group our data we'll write the code.
var groupByTotal = dimensionByTotal.group(function(d){ return Math.floor(d/100)*100; });
Here "dimensionByTotal " is the variable we just created to create dimension.
All we have done our data related stuff, now we will move to build a bar chart. For this create an object of bar chart.
var barChart = dc.barChart("#chart")
#barChart is the ID of the div in which we want to show our data.
var barChart = dc.barChart('#barChart')
                    .width(1024) // width of the chart
                    .height(200) // height of the chart
                    .dimension(dimensionByTotal) // dimension we create above passed as parameter
                    .group(groupByTotal) // group we created above passed as parameter to barChart method
                    .x(d3.scale.linear().domain([0,400])) // created x-axis scales
                    .xUnits(dc.units.fp.precision(100)); // it defines the units of x-axis
                    //.x(d3.scale.ordinal())
                    //.xUnits(dc.units.ordinal);
            barChart.yAxis().ticks(5);
            barChart.xAxis().ticks(4);

            dc.renderAll();
output

Odinal-Bar Chart
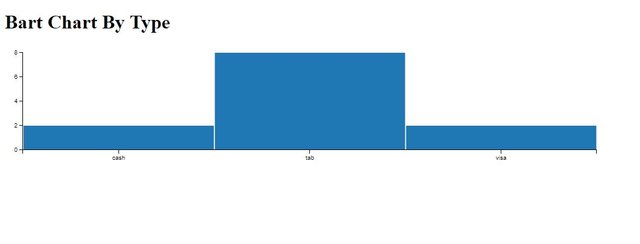
Bar charts that display the data that are classified into nominal or ordinal categories, such as in our raw data if we want to classified our data by Type, there are three types of data in our raw data, visa, tab, cash. If we develop a bar chart on type dimension the bar chart is called Odinal-Bar Chart.
To create ordinal bar chart just replace this code with specific methods in the code.
Total dimention with Type Dimension
var dimensionByType = facts.dimension(function (d){ return d.type;});
and Dimension Group with this new code
var groupByType = dimensionByType.group().reduceCount(function(d){ return d.type; });
reduceCount function counts the total number of records.
Then change the dimension and group variable from barCharts methods.
.dimension(dimensionByType)
.group(groupByType)
Change the x-axis scale and units to ordinal
.x(d3.scale.ordinal())
.xUnits(dc.units.ordinal)
Thats it, you see how it is easy to create charts with dc.js
Output

Posted on Utopian.io - Rewarding Open Source Contributors
Thank you for the contribution. It has been approved.
You can contact us on Discord.
[utopian-moderator]
Downvoting a post can decrease pending rewards and make it less visible. Common reasons:
Submit
Hey @faad I am @utopian-io. I have just upvoted you!
Achievements
Suggestions
Get Noticed!
Community-Driven Witness!
I am the first and only Steem Community-Driven Witness. Participate on Discord. Lets GROW TOGETHER!
Up-vote this comment to grow my power and help Open Source contributions like this one. Want to chat? Join me on Discord https://discord.gg/Pc8HG9x
Downvoting a post can decrease pending rewards and make it less visible. Common reasons:
Submit