
Data science and Machine learning has become buzzwords that swept the world by storm. They say that data scientist is one of the sexiest job in the 21st century, and machine learning online courses can be found easily online, focusing on fancy machine learning models such as random forest, state vector machine and neural networks. However, machine learning and choosing models is just a small part of the data science pipeline.
This is part 2 of a 4 part tutorial which provides a step-by-step guide in addressing a data science problem with machine learning, using the complete data science pipeline and python pandas and sklearn as a tool, to analyse and covert data into useful information that can be used by a business. The first part of the tutorial can be found here.
In the tutorial, I will be using a dataset that is publicly available which can be found in the following link:
https://archive.ics.uci.edu/ml/datasets/BlogFeedback
Note that this was used in an interview question for a data scientist position at a certain financial institute. The question was: whether this data is useful. It’s a vague question, but it is often what businesses face – they don’t really have any particular application in mind. The actual value of data need to be discovered.
In this second tutorial, we will be looking at the second step in the data science pipeline – statistical analysis of the data. You will be surprised that how much can be achieved or learnt from a dataset without needing to go to machine learning.
Recap
First, a quick recap from the last tutorial. We have loaded in our data, cleaned our data a bit, and now have a number of dataframes:
For this set of data, we can group the data into a number of dataframes as follows:
df_stats: Site Stats Data (columns 1 – 50)
df_total_comment: Total comment over 72hr (column 51)
df_prev_comments: Comment history data (columns 51 – 55)
df_prev_trackback: Link history data (columns 56 – 60)
df_time: Basetime - publish time (column 61)
df_length: Length of Blogpost (column 62)
df_bow: Bag of word data (column 63 – 262)
df_weekday_B: Basetime day of week (column 263 – 269)
df_weekday_P: Publish day of week (column 270 – 276)
df_parents: Parent data (column 277 – 280)
df_target: comments next 24hrs (column 281)
In this tutorial, we will be using more dataframe operations in pandas to perform data analysis.
Framing the problem
Before we dive in, it is time to step back and ask, what problem are we trying to solve. It is very important right from the start of a data science problem to have a clear idea of what you are trying to achieve.
In the interview, the question posed was – demonstrate whether this data is useful, for the social media department of the financial institution. One could for example suggest that maybe this data can be used to predict what posts are going to be hot in the next 24 hours, and the department can then put meaningful comments in these posts to increase the company's’ social media presence. This prediction problem obviously falls in the realm of machine learning (and will be addressed in the next tutorial). However, we may also use the dataset as a guide to look at how the department’s own blogposts can be improved. This can be done using simple statistical analysis.
So now, we have advanced, from a vague problem of “how can we use this data”, to specifically the problem of demonstrating “Predicting popular posts to improvement exposure” and “Improving popularity of own blog post”. Making the problem more specific is a key step in the data science pipeline. Here is a slide that I designed for the interview’s presentation, that convey this idea in more generic terms:

Statistical Analysis
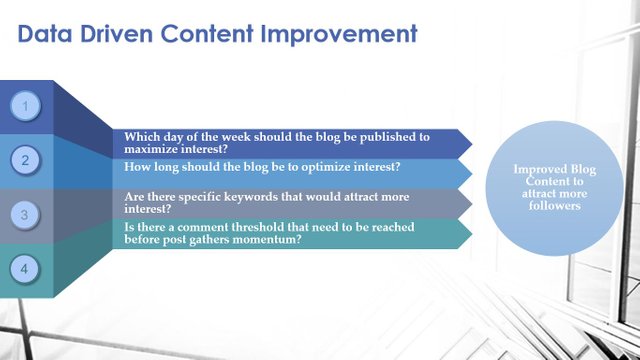
Now that we have the problem established properly, we can tackle it. For this tutorial, we will be tackling the second problem – use the dataset to improve the department's own social media content. This is equivalent to saying, can we find specific trends in the data that would statistically result in more comments. With statistical problems, it helps to form hypothesis or even simple questions that you want to answer, to give you a more concrete direction in the analysis. Here, base on the fact that we want to improve content to attract more followers, and base on what we know about the data, we may form the following hypothesis:
- That there is an optimal day of the week to publish for maximizing interest (e.g. publish on a weekend may mean that more people have time to look at it)
- That there is an optimal blog length that will maximise interest (i.e there is a perfect length for a post)
- That there are specific keywords that would attract more interest than others
- That the interest on a post need to exceed a certain threshold before it starts taking off
These ideas are presented in the slide below:
Let’s test out these ideas one by one. For the ease of analysis, let’s create a dataframe which stores the two key measures of post popularity – the total comment received in the past 72 hours, and the total comment received in the next 24 hours:

Recall the use of merge() to merge two dataframes. Use head() to have a look at the new dataframe:

So we have two columns, target_reg for the number of comments in the next 24 hours, and total_c for the total comments from the last 72 hours. The dataframe will be used over and over in this analysis.
For investigating the first hypothesis, we will take the dataframe that stores the day of week in which the blog was posted: df_weekday_P. We combined this with df_popularity for this analysis. To specify whether a post is considered of high interest, we could artificially define that any post that receives over 100 comments in total, is considered as high interest. We can then create a new column, called “high_interest”, which stores a True boolean value if the total number of comments (last 72 hours plus next 24 hours) is greater than a hundred:

Note how in Pandas, you can element-wise perform an operation using the standard operators. In this case here, we add the two columns element-wise, and then compare it element-wise to see if it is greater than 100 for each row. Also recall that accessing or creating a column in a dataframe is as simple as using the column header in a square bracket as indicated above (e.g. df_weekday_P[‘total_c’]) The result can be displayed using the head() function:

Now, how can we compare the popularity of posts that are published on a particular day-of-week? Well, we could count the number of posts for each day-of-week that is popular (i.e. high_interest = True). To do this, we can use the groupby() function and the agg() function. Both of these are database operations. The groupby() function allow one to group the data into different groups, and the agg() function which stands for “aggregate” allows one to create a statistic for a particular column in the dataframe. So, for example, if we want to see the number of high interest posts for each day of the week, then we basically want to group-by ‘Day_P’ column, and for each day, aggregate using the ‘sum’ statistics:

A quick note of the syntax. Both functions are called with the ‘.’ operator, similar to a class function. Also, note that for the agg() function, you pass in a dictionary to specify what you want to do with each column, and note how the statistical function is given in a list. This is because, for each aggregation, you can do multiple columns (specified by the dictionary), and for each column, you can specify multiple statistical functions to calculate. So for example, if you want, you can potentially do this:

which returns various statistical calculations for each column in the dataframe, as grouped by the Day_P variable. Going back to the problem, let’s look at the aggregated dataframe df3:

Which now stores for each day of the week the total number of high interest posts (since high_interest is boolean, and by default True = 1 and False = 0, the sum of the column essentially counts the number of true values in the column). We can plot this easily by using the build in plot function (and specify kind = 'bar' to plot a bar graph):
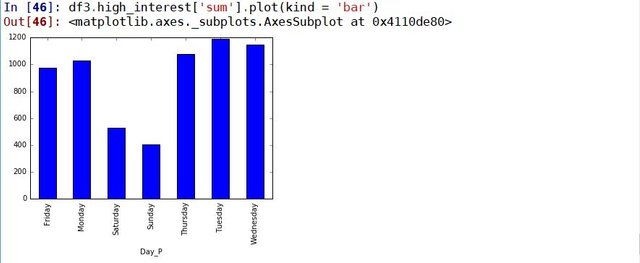
Note how you can pick out the aggregated statistics by using '.column_name' to extract the column of interest and '['stats_name']' to extract the aggregated statistics for that column. From the graph, it looks like that that actually posts will be less popular if it was published on weekends.
Importance of Normalisation
There is actually one major flaw in the data analysis above. And that is, we are not taking into account the total number of posts made on each day of the week to make the above conclusion. For example, say that there are 20 posts published on Monday that became popular, and Sunday there are 10 posts. From this one may say that it is better to publish on Mondays. However, we have not considered the fact that on Monday, a total of 100 posts have been published, whereas on Sunday, only 20 posts. This means that statistically, posting on Monday only give you 20% of success, whereas posting on Sunday give you 50% chance. So Sunday is in fact a better day for publishing, despite the total number of successful posts is less. The process of taking into account the total is called normalising, and it is a trap that a lot of people (including me) fall for.
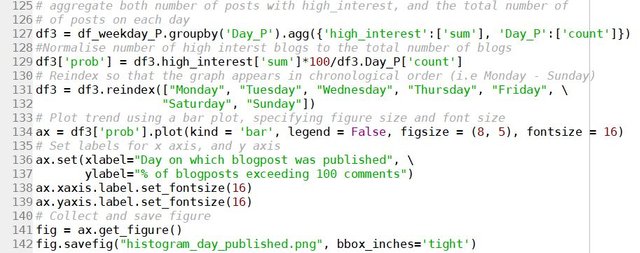
The correct way to analyse the data above is as follows: We aggregate the number of posts for each day, and create a column call 'prob' which is essentially the probability of a high interest post for each particular day, by dividing the number of high interest posts with the total number of posts. Note that here I have also cleaned up the graph a bit, by first reordering the columns so that the axis is displayed from Monday - Sunday using reindex(), and specify the figure size and font size. This is assigned to an axes object ax, which we can then manipulate by giving the graph a title and x,y labels, as well as saving the figure if so wished.
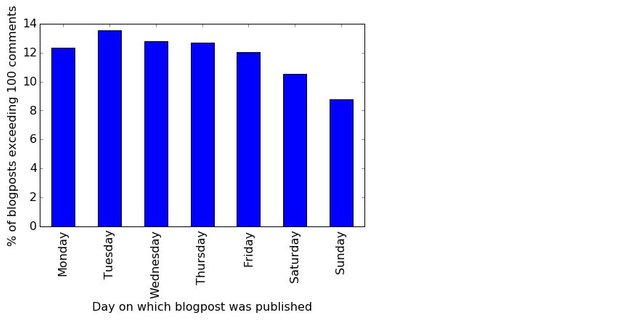
It can be seen now that with normalisation, the actual probability of high interest post is still lower for weekends, but not as dramatic as what we first thought.
Next, we will look at the effect of the length of the blogpost. We will perform a similar analysis, and we will look at both with and without normalisation again as an example. Note that the length of blogpost is a continuous variable, rather than a categorical variable like the day-of-week. Therefore, in order to use groupby() and agg(), we need to put these data into bins, i.e. assign each data point into a bin of word count range. For example, any blog posts that have a word count in between 0 and 500 words go into the first bin, blog posts with a word count in between 500 – 1000 words go into the second bin, and so on. This can be done by the following script:
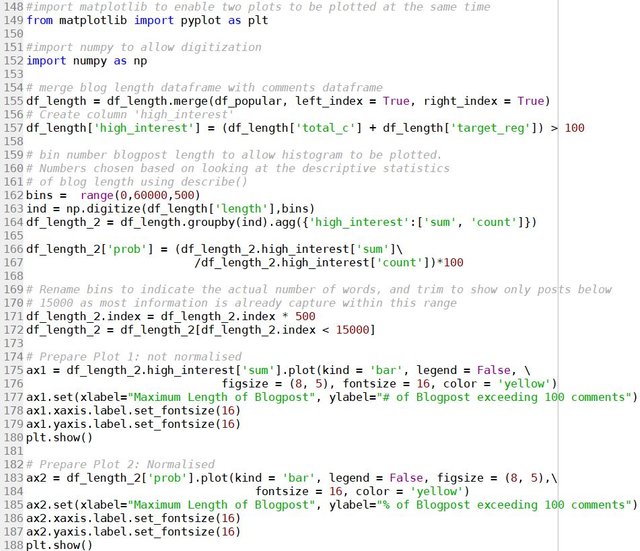
Note that the 'count' of the 'high_interest' column counts the number of entries for each bin, and therefore, gives the total number of post for each bin that is needed for the normalisation. Also note the use of digitize() for creating the bins, with is a numpy function, and the use of plt.show() to allow two plots to be shown at the same time, which is from matplotlib. The code also mention the use of the describe() function, which is a function you can use to look at the descriptive statistics for a column. The resulting graphs are shown below:
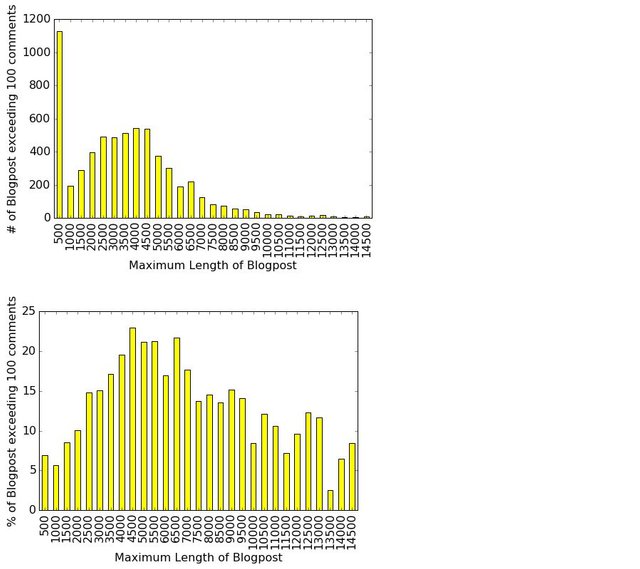
For this particular case, there is a huge discrepancy between the non-normalised and the normalised results. The non-normalised result suggests that we want blogposts with no words. But that is in fact skewed by the fact that most of the blogpost recorded overwhelmingly have no words. Statistically, by normalisation, we see that you actually get a higher chance of more popular post by having the blogpost within the 4500 - 6500 word count range.
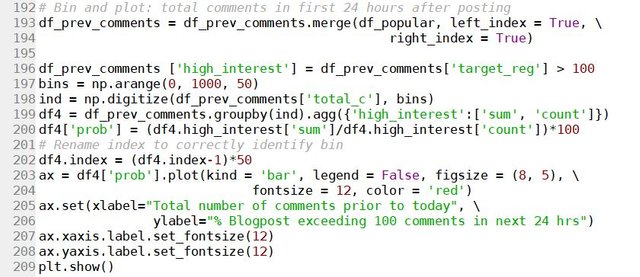
A similar approach can be used to tackle the last hypothesis, by looking at the dataframes previous comments and compare that to target_reg. This can be achieved with the scripts below:
And the result is shown below:
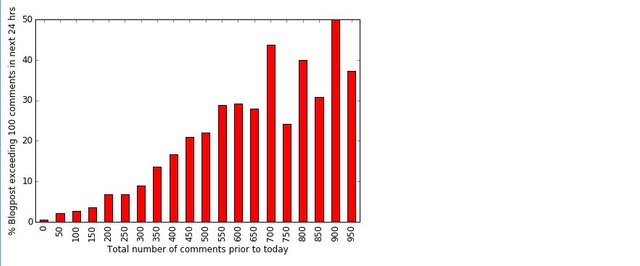
It can be seen that there is not a sharp threshold that needs to be reached for a post to become popular, but it seems that if the total number of comments prior to today is high, the probability of a post becoming popular in the next 24 hours is also high. One may use this information to think of a scheme to artificially increase the number of comments to generate the post's interest. However, this is probably not very practical.
Finally, let's look at keywords using the bag of words. This is associated with the dataframes which contain the bag-of-words column. Bag-of-words is a term used in natural language processing which describes whether a certain word is presence in a post. So the 200 columns in the dataframe represents whether or not one of the 200 selected keywords is present in the blog. We can therefore look at the impact of each of these keywords, by looking at the probability if a certain word is present (i.e. the specific column has a value of 1), that the post becomes popular. This is done with the following script:

Note that by grouping using high_interest, we create a dataframe that has two rows, 'False' and 'True' for each of the keyword columns. Therefore, by transposing the dataframe, we would then have a dataframe with two columns, 'False' and 'True', each gives the counts of non-popular post and popular posts respectively, from which the probability can be calculated. Also, because of the unfortunate naming (as True and False are keywords), we can only access the columns by column numbers through iloc. The result is as follows:
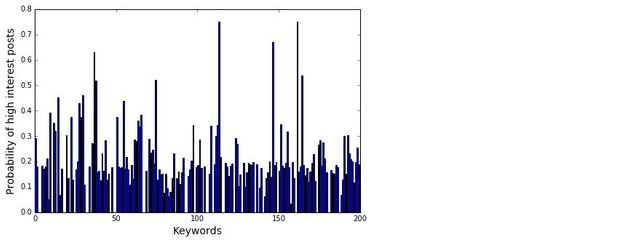
As can be seen from the figure, there are indeed keywords which gives a much higher probability of high interest posts compare to others. Therefore, by using these keywords, the popularity of a post should be improved.
Presenting the results the right way
So from the hypothesis above, we can find three things that we could actively do to improve the odds of a post successfully generating a high interest (the fourth hypothesis regards to the commenting threshold, although true, cannot be practically implemented). But how do we convey our discovery to the management? Our discovery needs to make an impression to whoever is in charge in order for a favourable decision to be made. We can present the above and vaguely say that following the guidelines above would improve the popularity of a blogpost. But, It would sound more convincing if we can put some number to it. To do that, we could calculate the probability of a post being successful if we apply these guidelines, compared to the probability of a post without using guidelines:
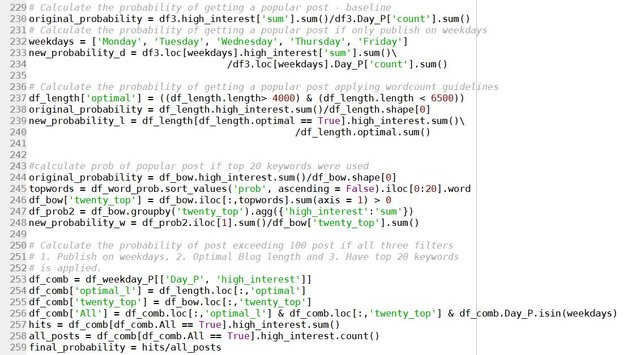
where we applied the guidelines: Post on weekdays, word count between 4000 - 6500 words, and include the top 20 most popular keywords. Note the use of sort_values() to sort the probability for the keywords to obtain the top 20 keywords, and use sum() > 0 to find records that have at least 1 of these keywords. Also note the use of '&' to perform element-wise 'and' to find records that have all three guidelines applied. The resulting probabilities can be found as follows:

So we can now say to the management that, by using the guidelines extracted from this dataset, we can improve the probability of a post being successful from just over 12% to 47%, which is almost 4 fold improvement. To make it more dramatic, I made the following slide:
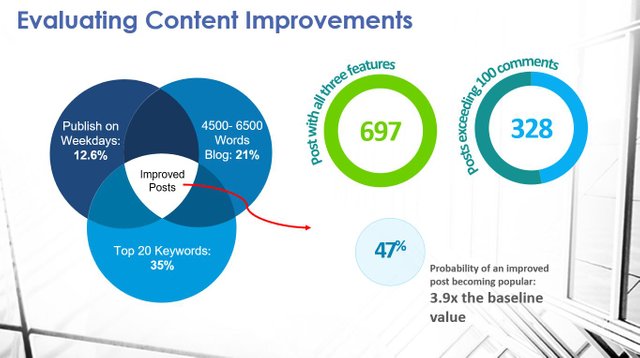
(Note: The interviewer commented that his slide was one of the best slides of my presentation)
So through statistical data analysis, we are able to use the data to demonstrate how one can improve the popularity of a blog post. This data is already showing immense value, without even going into any machine learning predictions. In the next tutorial, I will demonstrate how applying machine learning using scikit-learn will provide even more insights from the data.
Posted on Utopian.io - Rewarding Open Source Contributors
Thank you for the contribution. It has been approved.
Aaahhh, a fellow Pythonista!
Keep on contributing, great stuff! :-)
@scipio
You can contact us on Discord.
[utopian-moderator]
Downvoting a post can decrease pending rewards and make it less visible. Common reasons:
Submit
Thanks!
Downvoting a post can decrease pending rewards and make it less visible. Common reasons:
Submit
Tremendous job! Thank you for the code examples
Downvoting a post can decrease pending rewards and make it less visible. Common reasons:
Submit
Thanks. Hope it is helpful
Downvoting a post can decrease pending rewards and make it less visible. Common reasons:
Submit
Really good job man carry on thanks i like this post and your all post is very important and helpful thanks
Downvoting a post can decrease pending rewards and make it less visible. Common reasons:
Submit
Thank you. There will be 2 more parts coming.
Downvoting a post can decrease pending rewards and make it less visible. Common reasons:
Submit
I'm very interested in the subject, but I don't have a lot of time. I thought it would be a short and quick article to read. But when I saw the size I saved it directly in my favorites.
I will come back to read it again you really put your heart and soul into the work here!
Downvoting a post can decrease pending rewards and make it less visible. Common reasons:
Submit
Thanks. It is meant to be a tutorial on working through a data science problem, so yeah, it would be a bit time consuming, and most helpful for those that can download the data and work through the problem with python. I think that's the best way to learn. But if you are short on time, the main take away is in bold. These are key points that I have learnt during my interview.
Downvoting a post can decrease pending rewards and make it less visible. Common reasons:
Submit
I might also think about writing a small piece later on, may be less technical and more general approaches.
Downvoting a post can decrease pending rewards and make it less visible. Common reasons:
Submit
This is good post about python. What is your opinion on Tableau?
Downvoting a post can decrease pending rewards and make it less visible. Common reasons:
Submit
I have not used Tableau before. My opinion is that it is a very good visualisation tool, especially for presenting data to a general, non technical audience. However, because it is not open source, it is hard for amature data scientists like me to pick up and learn.
Downvoting a post can decrease pending rewards and make it less visible. Common reasons:
Submit
very interesting and a great post thanks you
Downvoting a post can decrease pending rewards and make it less visible. Common reasons:
Submit
Thank you for visiting.
Downvoting a post can decrease pending rewards and make it less visible. Common reasons:
Submit
Hey @stabilowl I am @utopian-io. I have just upvoted you!
Achievements
Suggestions
Get Noticed!
Community-Driven Witness!
I am the first and only Steem Community-Driven Witness. Participate on Discord. Lets GROW TOGETHER!
Up-vote this comment to grow my power and help Open Source contributions like this one. Want to chat? Join me on Discord https://discord.gg/Pc8HG9x
Downvoting a post can decrease pending rewards and make it less visible. Common reasons:
Submit
Come and learn how AI processes images :)
Downvoting a post can decrease pending rewards and make it less visible. Common reasons:
Submit