What happens when we build a large software package? A lot!
Visualizing the inputs and outputs of a build
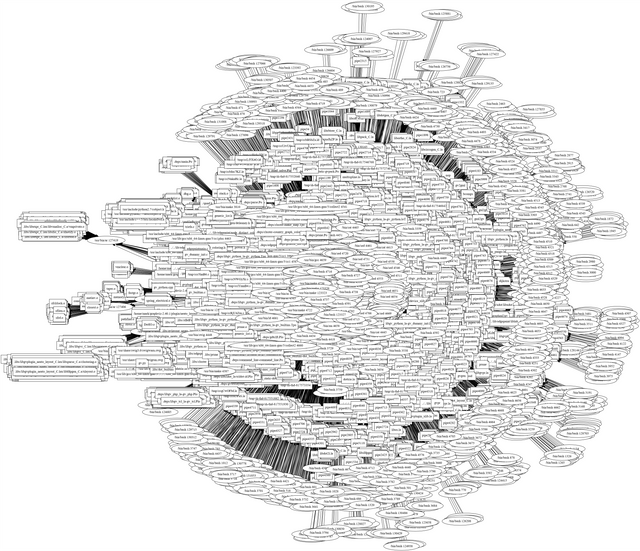
Here's a graph of every process that read or wrote a file while building the 'graphviz' toolkit, connected to the files they accessed:

Obviously this is pretty useless as a visualization; the scale is simply too big. (You can zoom in by opening the image above in a new browser tab.) There are over 150,000 nodes in the graph, and the resulting SVG file is over 48MB!
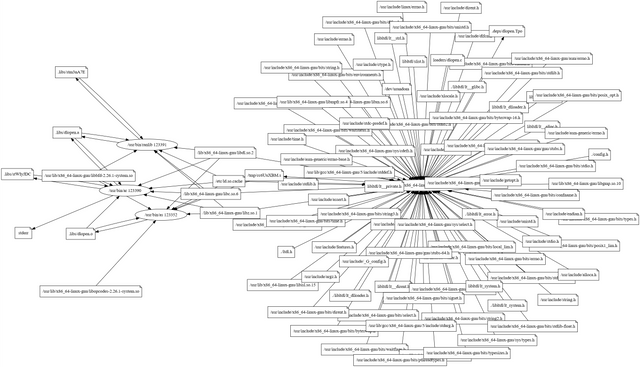
Here's just one C file that gets compiled into a static library (a ".a" file):

Now we can see a lot more of what's going on. The C compiler reads a lot of header files in addition to the source file. It produces an assembly file /tmp/cc6UuXBM.s. That is fed to the assembler to produce libs/dlopen.o. To make a library, the ar program is run, then ranlib. Both read and write dlopen.a but also temporary files.
Also, many of these executables access the same shared library files which they need in order to run.
Tracing a build process
One way to capture this information is with the Linux strace utility, which attaches to a process and reports on every system call that the process makes. With the -f flag, strace will also attach to any child processes that are created, so we can see their behavior as well. Some sample output:
123352 execve("/usr/bin/as", ["as", "-I", ".", "-I", ".", "-I", ".", "-I", "libltdl", "-I", "./libltdl", "-I", "./libltdl", "--64", "-o", ".libs/dlopen.o", "/tmp/cc6UuXBM.s"], ...] <unfinished ...>
123350 <... vfork resumed> )            = 123352
123350 wait4(123352,  <unfinished ...>
123352 <... execve resumed> )           = 0
123352 brk(NULL)                        = 0x153b000
123352 access("/etc/ld.so.nohwcap", F_OK) = -1 ENOENT (No such file or directory)
123352 access("/etc/ld.so.preload", R_OK) = -1 ENOENT (No such file or directory)
123352 open("/etc/ld.so.cache", O_RDONLY|O_CLOEXEC) = 3
123352 fstat(3, {st_dev=makedev(8, 1), st_ino=262393, st_mode=S_IFREG|0644, st_nlink=1, st_uid=0, st_gid=0, st_blksize=4096, st_blocks=200, st_size=101324, st_atime=2018/06/25-18:00:27.953723236, st_mtime=2018/06/20-15:59:09.668493058, st_ctime=2018/06/20-15:59:09.672493061}) = 0
123352 mmap(NULL, 101324, PROT_READ, MAP_PRIVATE, 3, 0) = 0x7fc8f03fd000
We can see each system call, its parameters, and the return value. That means we can tell which files were opened, and by tracking their file IDs, we see whether the program read or wrote to those files. We can tell when a subprocess is started, and which program that subprocess is; look at the execve system call for an example. Some of these system calls map closely to standard library functions; others are more obscure.
Ideas for future work
Is there a level between the graph of everything and the graph of just one file that is interesting? We could certainly prune out some of the junk like standard include files--- yet those are certainly part of the build. We might be able to group files that are treated similarly and highlight only the differences.
I could trace a smaller build that might graph more easily, now that I have the tooling in place.
Instead of graphing both processes and files, we could graph files only, as a dependency diagram.
A node-and-edge visualization might not be as meaningful as an X-Y plot with files along one axis and processes along another (though the large number of both means that the individual points would still be pretty small.)
Plotting as an adjacency diagraph doesn't work so well at scale, unsurprisingly, because there's so much white space. Most files are only accessed by a few files, most processes only access a few files. The exceptions stand out but not much else (if you zoom in you can see the some diagonal lines where my sort order matched time order.)
Downvoting a post can decrease pending rewards and make it less visible. Common reasons:
Submit
Here's the graph limited just to the 'make' processes, which still have a suprising number of files they read:
(Also I switched graphviz to use the 'overlap=false' option which spreads things out a bit more.)
Downvoting a post can decrease pending rewards and make it less visible. Common reasons:
Submit
I attempted to group files into graphviz clusters depending on whether they were read-only write-only, or read/write. But the sfdp layout method doesn't support this feature, and the others take too long at large scale.
Downvoting a post can decrease pending rewards and make it less visible. Common reasons:
Submit