Hello all,
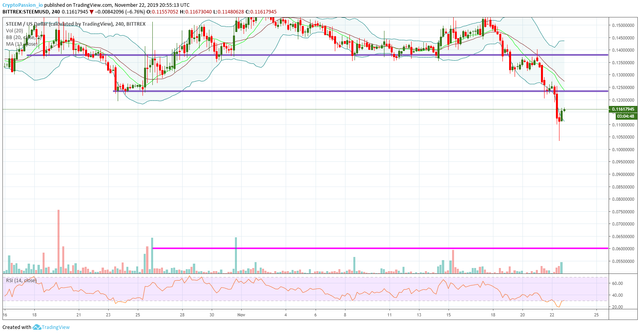
Here is the chart of my last analysis :

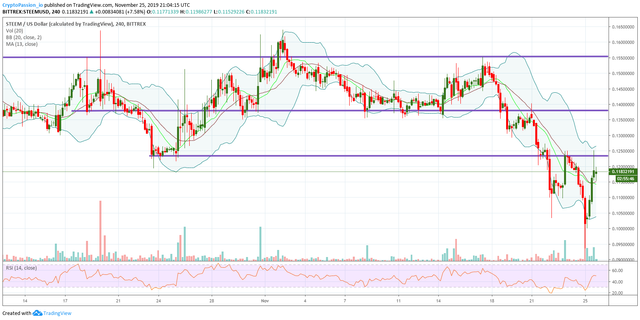
Here is the current chart :

It looks like that the market would like to test again the resistance line at 0.124$. We are staying just under it and till now, a new drop is not yet validated. Buyers are back in the game and have in mind to try to break the resistance line. So for sure we are still in a bearish trend but the sellers start to have difficulties to go lower immediatly. So it is an opportunity that buyers will try to use to go back upper than this resistance line.

I traced in pink the all time low on the STEEM. What do you think? Will we go test that all time support line ?
I wish you massive profits,
Cryptopassion.io
Legal Disclaimer : Never invest more than what you can afford to lose. I am not a financial advisor and the content in this article is not a financial advice. This post is for informational purposes only and provides only my personal opinion. It is important that you do your own research before making any investment decisions. If you make any trades after reading this post, it is completely in your responsibility. I am not responsible for any of your losses. By reading this post you acknowledge and accept that.


.gif)

.gif)
@tipu curate
Downvoting a post can decrease pending rewards and make it less visible. Common reasons:
Submit
Upvoted 👌 (Mana: 0/3 - need recharge?)
Downvoting a post can decrease pending rewards and make it less visible. Common reasons:
Submit
Nice article
Downvoting a post can decrease pending rewards and make it less visible. Common reasons:
Submit