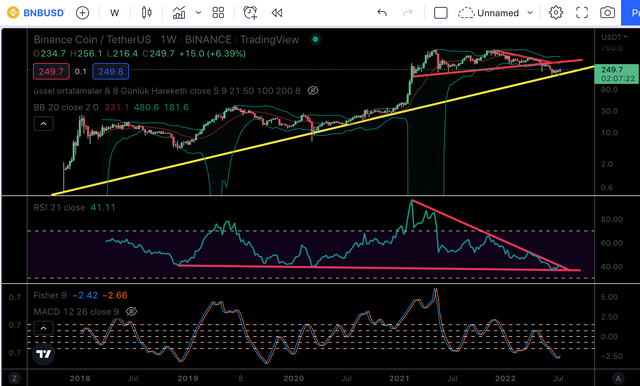
BNB Price chart seems ultra mega bullish for me. Logarithmic Price chart of BNB show us everything is okey for crypto. BNB is important for me to see crypto markets future.. If BNB price chart broken down yellow support line, crypto market may enter ultra mega bearish season.. It may be the end of dream...
Yellow support line may be the best level to pick up BNB or other cryptos.
I shared a post about BNB 3 weeks ago and said same things that I was looking BNB price chart to see crypto markets future.
Future is bright...

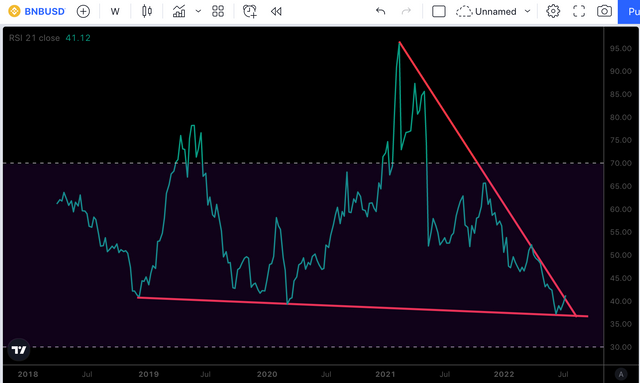
Weekly RSI Indicator of BNB has great setup for big pump! There is ultra mega positive divergence in RSI Indicator. Price is going up but the bottom of RSI Indicator going down. It is positive divergence, shows us correction of RSI for big pump...

I am very possitive for crypto market. BNB is one of my great signal to see crypto market. BNB is ultra mega bullish. So, Market?
Your post was upvoted and resteemed on @crypto.defrag
Downvoting a post can decrease pending rewards and make it less visible. Common reasons:
Submit